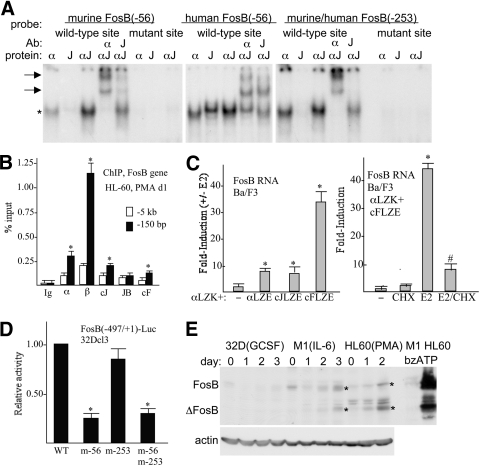
Figure 7. Regulation of the FosB promoter by C/EBP:AP-1 heterodimers.
(A) Gel-shift assay was conducted with the indicated radiolabeled probes with IVT, myc-tagged proteins C/EBPα (α) and eightfold c-Jun (J) on a per-mol basis, or their combination at a 1:8 mol ratio (αJ). Where indicated, super-shift was conducted by further addition of C/EBPα or c-Jun antisera. Arrows indicate super-shift complexes. (B) HL-60 cells cultured in PMA for 1 day were subjected to ChIP assay using rabbit IgG or C/EBPα, C/EBPβ, c-Jun JunB, and c-Fos antiserum. Shown is the signal obtained, expressed as percent input using primers centered on the FosB –150-bp promoter region or on a more distal –5-kb control region (mean and se). *P < 0.05 versus Ig control. (C) FosB RNA levels were evaluated in the Ba/F3 cell lines expressing C/EBPαLZK-ER (αLZK) together with empty vector (–), C/EBPαLZE-ER (αLZE), c-JunLZE-ER (cJLZE), or c-FosLZE-ER (cFLZE) 24 h after culture in the presence or absence of E2, with triplicate data expressed as an induction ratio (+E2/–E2; left, mean and se). *P < 0.05 versus empty vector cells. Induction of FosB RNA was then assessed similarly at 8 h using cells expressing C/EBPαLZK-ER and c-FosLZE-ER with no addition (–), CHX, E2, or both (E2/CHX). CHX was added 30 min prior to E2 (right, mean and se). *P < 0.05 for E2 versus no addition; #P < 0.05 for E2 versus E2/CHX. (D) FosB(–497/+1)-Luc (5 μg) or the indicated mutant variants were transiently transfected together with CMV-β-galactosidase (0.5 μg) into 5 × 10⁶ 32Dcl3 cells in IL-3, and luciferase and β-galactosidase assays were conducted 48 h later. FosB promoter activity relative to WT (set to 1.00) is shown (mean and se from three experiments). *P < 0.05 versus WT. (E) Total cellular proteins from 32Dcl3 cells cultured in G-CSF for 0–3 days, M1 cells cultured in IL-6 for 0–3 days, HL-60 cells cultured in PMA for 0–2 days, or M1 or HL-60 cells exposed to bzATP for 5 min were subjected to Western blotting for FosB and β-actin. *Locations of FosB and ΔFosB induced in the monocytic lines.

