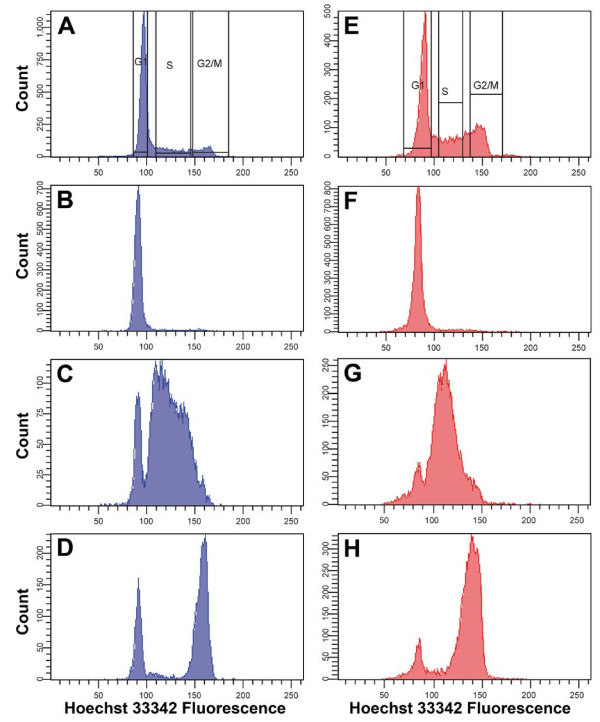
Figure 5.
DNA histograms with sorting gates of Hoechst 33342-stained (A) T cells and (E) Jurkat cells. After cell sorting, the different cell populations were reanalyzed. (B-D) Reanalysis of sorted T-cell populations in (B) G1, (C) S, and (D) G2/M populations. (F-H) Reanalysis of sorted Jurkat populations in (F) G1, (G) S, and (H) G2/M populations.

