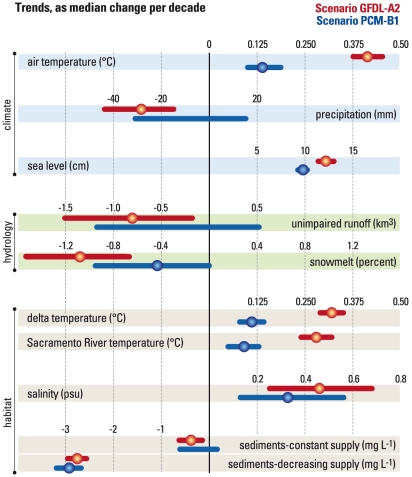
Figure 3. Projected 2010–2099 changes in nine environmental indicators, expressed as median trend per decade, for the A2 scenario (red) and B1 scenario (blue).
Statistically significant (p<0.05) trends are indicated with solid circles; horizontal lines show 95% confidence limits of the trend estimates.

