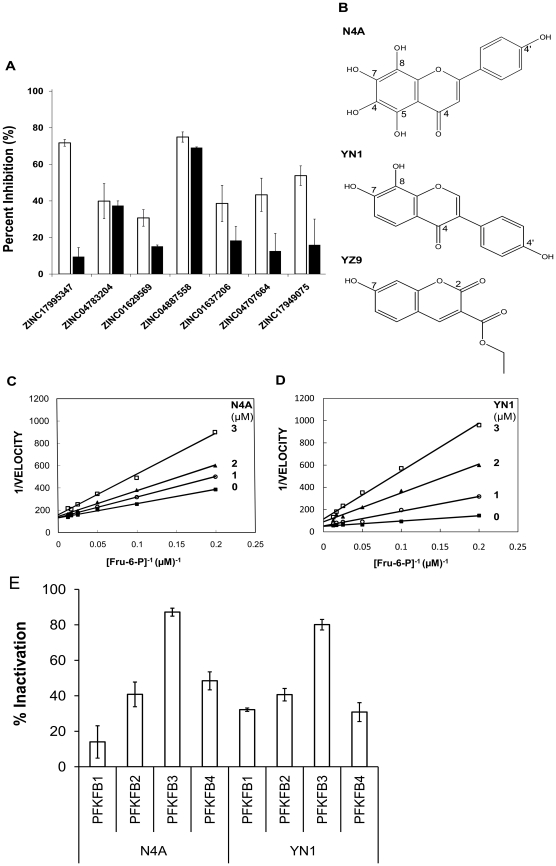
Figure 2. Experimental evaluation of the hit compounds.
(A) Inhibition potencies of the candidate compounds. The magnitudes of inhibition by compounds at 10 µM each are measured through the enzyme assay and presented as percentiles against the control (□). A same experiment was also performed in the presence of 0.1% Tween-20 (▪), to eliminate false positives caused by nonspecific hydrophobic interactions. (B) Structures of the PFKFB3 inhibitors. (C) Lineweaver-Burk plots showing the competitive inhibition by N4A against Fru-6-P. The inhibitor concentrations used were: 0 µM (▪), 1 µM (○), 2 µM (▴), and 3 µM (□) of N4A. They are also labeled next to individual plots. (D) Lineweaver-Burk plots showing the competitive inhibition by YN1 against Fru-6-P. The inhibitor concentrations used were: 0 µM (▪), 1 µM (○), 2 µM (▴), and 3 µM (□) of N4A. (e) Selectivity of N4A and YN1 on PFKFB isoforms. Results are expressed as percent inhibition at twice the IC50 concentration against PFKFB3 (N4A = 6 µM, YN1 = 1.3 µM).

