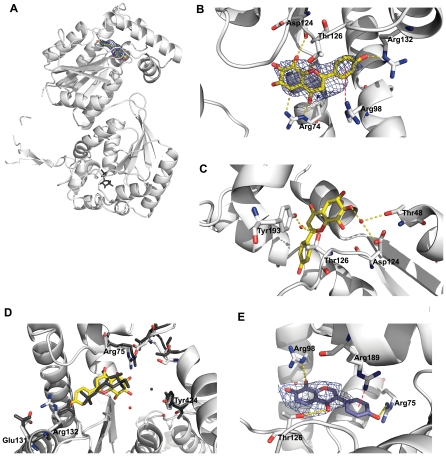
Figure 6. Structure of PFKFB3 in complex with inhibitors.
(A) Ribbon diagram of the crystal structure of the PFKFB3•N4A complex. N4A bound to the PFKFB3 Fru-6-P site in the 2-Kase catalytic pocket is shown with a concomitant |Fo|−|Fc| omit map at a 2.5 level. The Fru-6-P bound to the 2-Pase domain is also shown in gray for comparison. (B)The interactions between N4A and PFKFB3 are shown. Hydrogen bonds are shown as yellow dotted lines and a Cation-π interaction is represented by a red broken line. (C) The water-mediated hydrogen bonds between PFKFB3 and N4A are shown in yellow dotted lines. (D)Inhibitor-induced local conformational changes around the N4A binding groove. Comparison of the structures of the PFKFB3•AMPPCP•Fru-6-P complex (dark gray) and the PFKFB3•N4A complex (color) was made. (E)YN1 bound to the same pocket with a |Fo|−|Fc| omit map at 2.5 level is shown. Hydrogen bonds between YN1 and PFKFB3 are shown as yellow dotted lines and Cation-π interactions as red broken lines.

