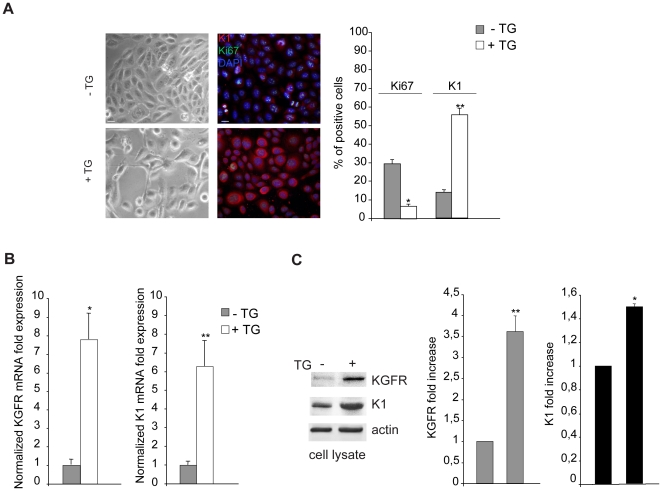
Figure 2. Thapsigargin-induced differentiation is associated with increased KGFR expression.
(A) HaCaT cells were treated with TG 0.5 µM for 1 h at 37°C following by incubation at 37°C for 48 h. Cells treated with equal amount of DMSO solvent were used as a control. Phase contrast microscopy analysis shows that the TG-treated cells appear detached each other and elongated, while control cells are closely packed and polygonal (left panels). Quantitative immunofluorescence analysis using anti-Ki67 and anti-K1 antibodies shows that TG treatment significantly decreases the percentage of cells expressing the proliferative marker Ki67 and increases that of cells positive for the early differentiation marker (right panels). Cell nuclei were visualized by DAPI. The quantitative analysis was assessed by counting for each sample a total of 50 cells, randomly observed in 10 microscopic fields from three different experiments. Cut-off of the K1 signal intensity was determined for TG-treated and control samples as described in materials and methods. Results are expressed as mean values ± standard errors (SE). Student's t test was performed and significance level has been defined as *p<0.001 and **p<0.05 vs the corresponding untreated cells. (B) Quantitative real-time RT-PCR of KGFR and K1 mRNA transcript levels on TG-treated and control HaCaT cells shows an evident increase in both KGFR mRNA (left panel) and K1 mRNA (right panel) expression upon TG-treatment. Student's t test was performed and significance level has been defined as *p<0.005 and **p<0.001 vs the corresponding untreated cells. (C) Western blot analysis shows that the KGFR band, which is hardly detectable in control cells, becomes well visible in TG-treated cells. Enhancement of K1 protein expression is also evident upon TG treatment. The equal loading was assessed with anti-actin antibody. For densitometric analysis of the bands, the values from three independent experiments were normalized, expressed as fold increase and reported in graphs as mean values +/− SD. Student's t test was performed and significance level has been defined as *p<0.001 and **p<0.001 vs the corresponding untreated cells.

