
Figure 3.
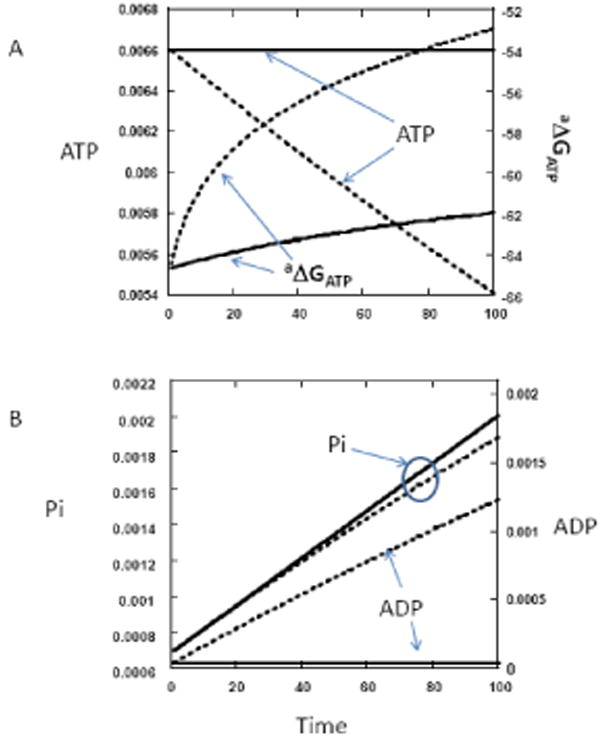
Simulations as conducted in Figure 2 but with and without the addition of a creatine kinase equilibrium reaction. After each step in ATP hydrolysis (2% hydrolysis steps), the creatine kinase reaction was permitted to reach equilibrium through a numerical approximation. The creatine kinase equilibrium constant was assumed to be 1.66×10⁹. pH was 7.0. Other parameters were identical to those in Figure 2. A) Plot of ATP and the ΔGATP with, solid line, and without the creatine kinase reaction, dotted line. B) Plot of ADP and Pi with, solid line, and without the creatine kinase reaction, dotted line.