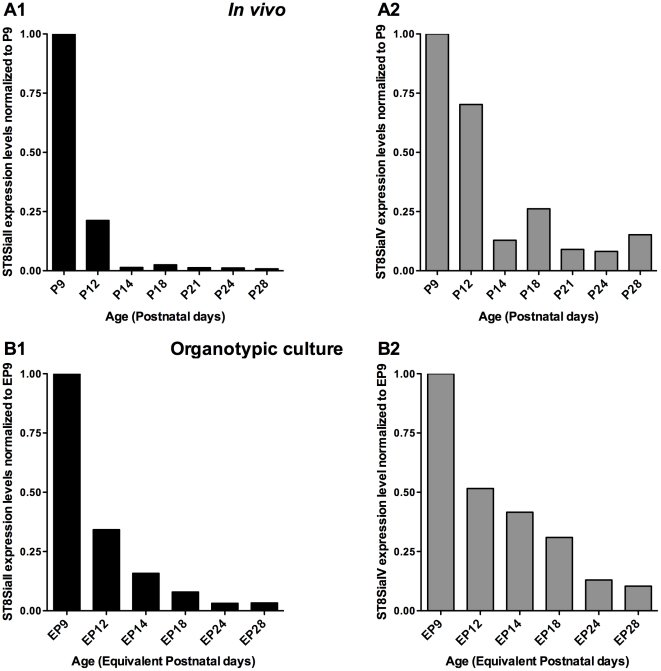
Figure 1. Expression levels of ST8SiaII (black bars) and ST8SiaIV (gray bars) mRNA decline in mouse visual cortex (A) and organotypic culture (B) with a similar time course during postnatal development.
ST8SiaII and ST8SiaIV mRNA expression were first normalized to the internal control GAPDH. Bar graph represent the mean of at least two animals (A) or 6 cortical organotypic slices (B), normalized to the value obtained at P9.

