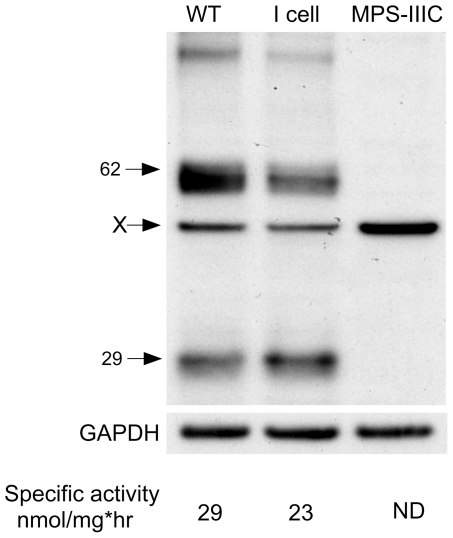
Figure 5. Western blot analysis of the endogenous N-acetyltransferase protein in three human fibroblast cell lines.
Fibroblast from an unaffected individual (WT), a patient with I-Cell disease, and a MPS IIIC patient were extracted with 1% DDM, 20 µg each of extracted protein were separated by SDS-PAGE, and the N-acetyltransferase proteins visualized using the N-terminal antibody. The blot was reprobed with anti GAPDH as a loading control. The specific activity of each extract is shown at the bottom, ND is not detected.

