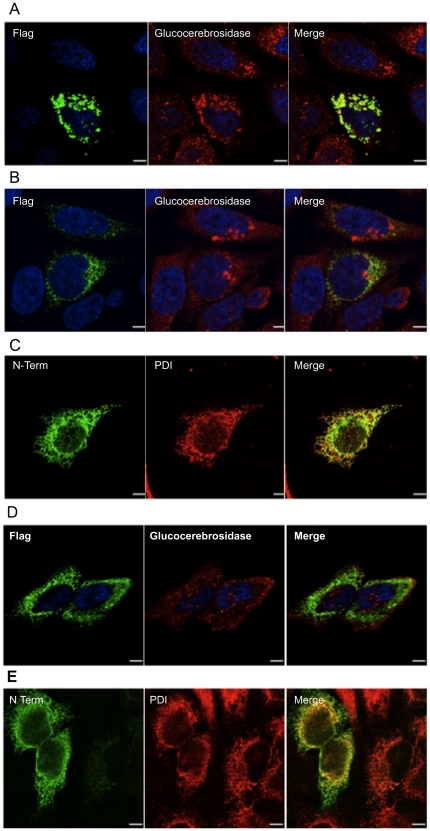
Figure 9. Indirect immunofluorescence staining and confocal microscopy imaging of HeLa cells transiently expressing various forms of N-acetyltransferase.
(A) N-acetyltransferase-His8Flag, (B & C) myc-N-acetyltransferase-His8Flag, or (D & E) the N-terminal segment (Met1-Asn163-His8Flag) of N-acetyltransferase (Fig. 1). Cells were stained with the mouse M2 Flag antibody (green A, B & D) and a rabbit antibody against either a lysosomal marker, glucocerebrosidase (red, A, B & D), or against the N-terminus of N-acetyltransferase (green) and a mouse antibody against a ER marker, PDI (red, C & E), and the images merged. Scale bars represent 10 µm. Images shown are representative of 10 recorded.

