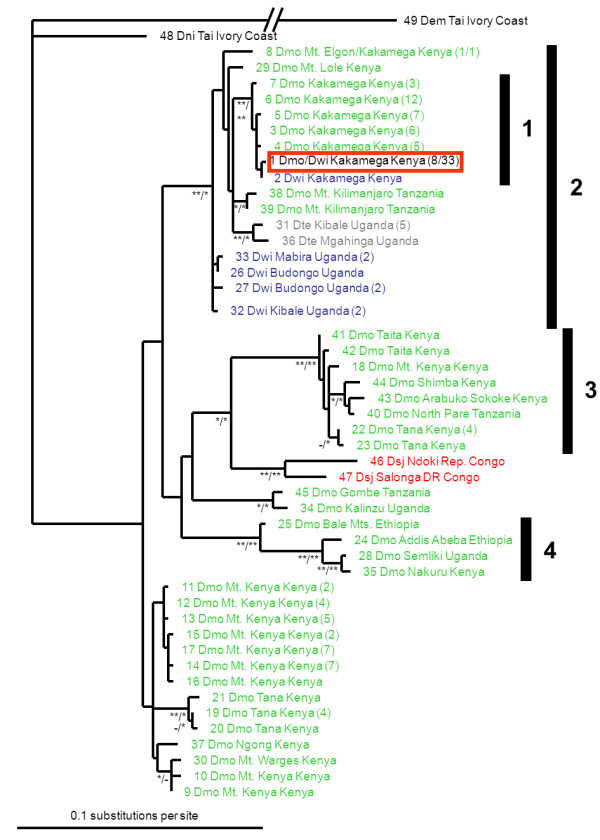
Figure 3.

Maximum likelihood phylogram showing relationships between mitochondrial haplotypes of East African Dorylus (Anomma) swarm-raiding army ants. Each label gives the haplotype number (see Table 1), the abbreviated species name (Dem: D. emeryi; Dmo: D. molestus (green); Dni: D. nigricans; Dsj: D. sjoestedti (red); Dte: D. terrificus (grey); Dwi: D. wilverthi (blue)), the sample locality, and the sample size in parentheses for haplotypes that were sampled more than once. Numbered bars on the right refer to clades that are discussed in the text. Node labels represent posterior probabilities from Bayesian analyses (*: 0.95 - 0.99; **: 1.0)/maximum likelihood bootstraps (*: 0.75 - 0.9; **: > 0.9). No internal labels or a hyphen indicate support values < 0.95 and < 0.75 for the Bayesian and maximum likelihood analysis, respectively. The haplotype that is shared between the D. molestus-like and the D. wilverthi-like forms at Kakamega Forest is highlighted in a red box.
