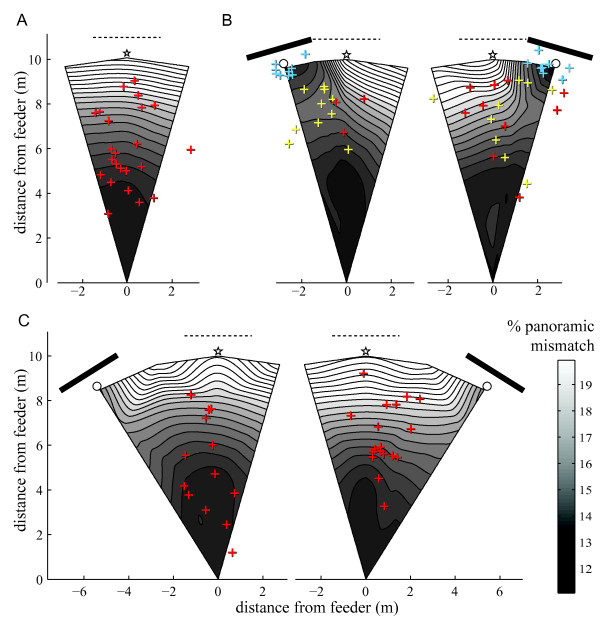
Figure 2.
Maps of panoramic mismatches and first U-turn locations. The maps result from comparing panoramic pictures taken during Removal of the landmark (A), Rotation 16° (B) and Rotation 32° (C) tests with reference pictures from the training condition. '% of panoramic mismatch' indicates the percentage of mismatching pixel across the image. Locations for comparisons are shown in the Additional file 1. Mismatch levels were then interpolated between those locations (triangle-based cubic interpolation). The darker the shade, the lower the mismatch between views. Each cross represents the location of the first U-turn (walking at least 20 cm back towards the feeder within 50 cm of displacement) of the ants. Red crosses: first U-turns of ants that never searched densely in front of the landmark. Yellow crosses: first U-turn of ants that displayed a U-turn before searching in front of the landmark. Blue crosses: first U-turn of ants that displayed no U-turn before searching in front of the landmark (Blue crosses thus correspond to the beginning of the search). Bar: landmark position during test. Dashed line: landmark position during training. Stars: nest position. White circle: fictive nest position relative to the landmark.

