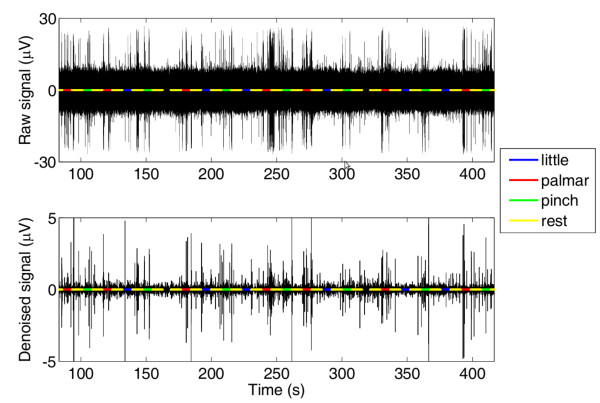
Figure 3.
The raw (top panel) and the denoised (bottom panel) LIFE motor signals. Superimposed with the signal (black line) are shown signals, which represent the different tasks the subject was asked to perform (rest = yellow line; flexion of the little finger = blue line; palmar grasp = red line; pinch grasp = green line).

