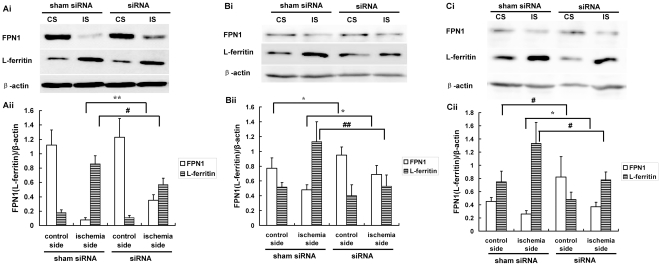
Figure 5. Expression of FPN1 and L-ferritin protein levels in the cerebral cortex, hippocampus and corpus striatum of mouse after hepcidin siRNA injection in the lateral cerebral ventricle.
A representative Western blot of the FPN1 and L-ferritin was presented. Quantification of expression of PFN1 and L-ferritin protein in the cerebral cortex (A), hippocampus (B) and corpus striatum (C) of mouse. Expression values were normalized for β-actin. The data were presented as means ± SEM, n = 3. *p<0.05, **p<0.01 vs. FPN1 of ischemic side (IS) or control side (CS), #p<0.05, ##p<0.01 v.s. L-ferritin of ischemic side (IS) or control side (CS). Sham siRNA (negative control treated group), siRNA (specific hepcidin siRNA treated group).

