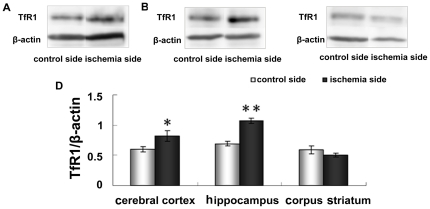
Figure 8. Expression of TfR1 in cerebral cortex (A), hippocampus (B) and corpus striatum (C) of contralateral and ipsilateral side by western blot analysis.
Representative TfR blots and corresponding β-actin blots are shown on the top panel. The lower panel (D) shows the summary of TfR expression from three animals in each group. Results are presented as Mean ± SEM, n = 3. **p<0.01 v.s. contraleteral side, *p<0.05 v.s. contralateral side.

