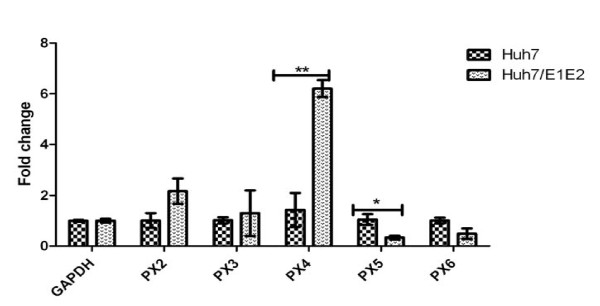
Figure 2.
P2X receptors genes expression analysis in Huh-7/E1E2 compared to Huh-7 cell line. All values were expressed as mean ± SEM *P ≤ 0.05 vs. control Huh-7. Results were obtained from 6 independent experiments with replicate samples in each experiment are shown. P2X4 showed most response to HCV structural proteins E1E2.

