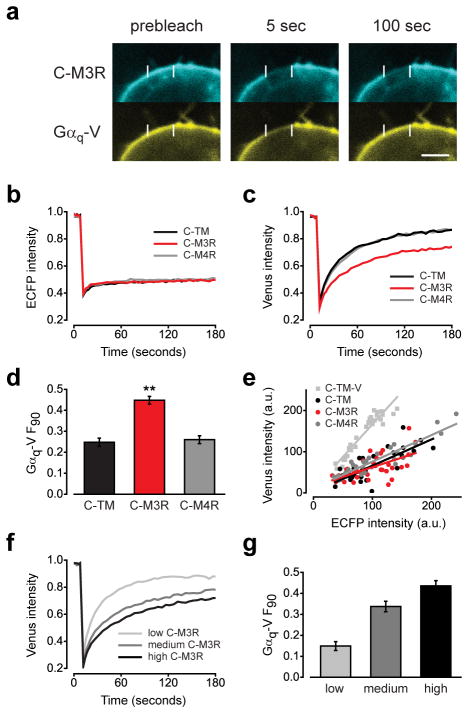
Figure 1. Immobile C-M3R decreases Gαq-V mobility.
(a) HEK293 cells transiently expressing C-M3R, Gαq-V, Gβ1 and Gγ2 were biotin-avidin crosslinked and imaged before and after photobleaching of a 4 μm segment of the plasma membrane; scale bar=4 μm. Recovery of ECFP (b) and venus (c) fluorescence after photobleaching in cells expressing immobile C-TM (n=31), C-M3R (n=32) or C-M4R (n=33); traces are averages of all cells. (d) Unrecovered fluorescence 90 seconds after photobleaching (F90) for cells expressing C-TM, C-M3R and C-M4R; **, P<0.001 compared to C-TM. (e) ECFP and venus intensity at the plasma membrane for the same cells as panels b-d, and for cells expressing C-TM-V. C-TM, C-M3R and C-M4R were expressed in excess of Gαq-V. (f) Gαq-V fluorescence recovery after photobleaching in cells expressing low (n=16), medium (n=23) and high (n=17) levels of C-M3R and constant levels of Gαq-V. Average C-M3R fluorescence intensity in these three groups was 58 ± 3, 106 ± 3, and 150 ± 6 arbitrary units, respectively. Average Gαq-V fluorescence intensity was 85 ± 5, 86 ± 7, and 92 ± 8 a.u., respectively. (g) Unrecovered fluorescence in the same cells as panel f. Data represent mean values ± s.e.m..

