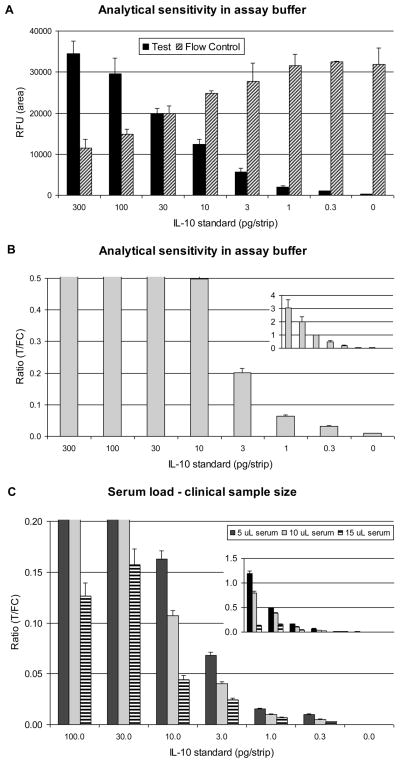
Fig. 3. Analytical sensitivity of the UCP-LF assay for IL-10 detection.
Analysis of dilution series of IL-10 standard (in pg per 100 μL final assay volume, or pg/strip) analyzed with the UCP-LF IL-10 assay. Panel A: An assay without human serum (buffer only); histogram with the signal (RFU) measured at the Test line (T) and Flow-Control line (FC). Panel B: Ratio (R=T/FC) values calculated from panel A signals. Panel C: Assay with 5, 10 or 20% human serum; histogram with the Ratio value. Error bars indicate the standard deviation of the triplicates.

