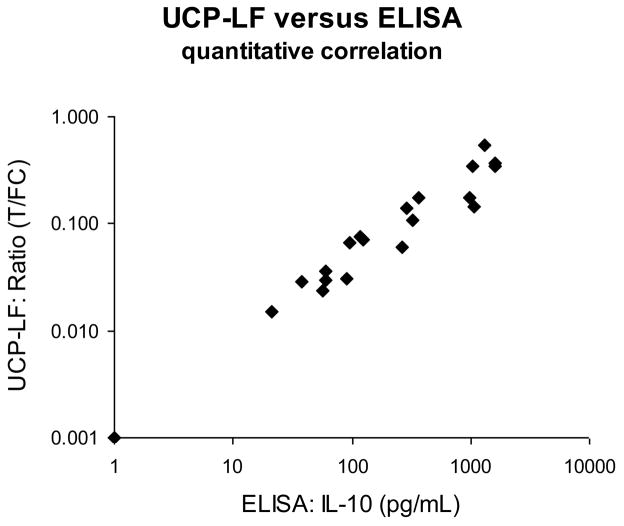
Fig. 4. Comparison of ELISA and UCP-LF assays: evaluation of clinical samples.
ELISA and UCP-LF IL-10 assays were performed in parallel on 24 samples of stimulated whole blood or PBMC from leprosy patients and healthy non-endemic controls. The average UCP-LF Ratio (n=2) value is plotted on the y-axis against the ELISA-determined IL-10 concentrations on the x-axis (double log). Coefficient of determination for all samples R2 = 0.86, for samples below 250 IL-10 pg/mL R2 = 0.92.

