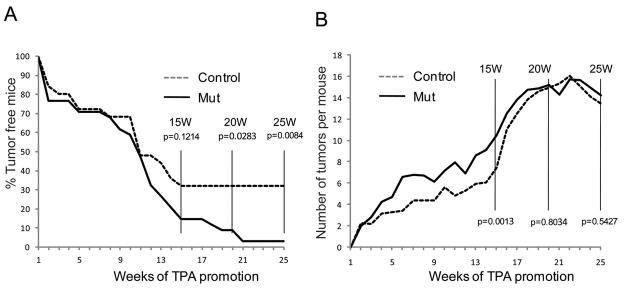
Figure 3.
Comparison of tumor development in mutant and control mice. (A) Kaplan-Meier graph showing the percentage of tumor-free mice over time (weeks of TPA treatment). Note that mutant mice showed a significant increase in tumor incidence which reached statistical significance at the 20 week time point (p<0.05). At this time point, 32% of the control mice were free of tumors while only 9% of the mutants had not developed visible tumors. (B) Average number of tumors in tumor-bearing mice. Note that mutants showed a slightly but statistically significant higher number of tumors by 15 weeks of TPA treatment. Nevertheless, control animals eventually caught up and both genotypes yielded similar average tumor loads at the end of the observation period (25 weeks of TPA treatment).

