Figure 4.
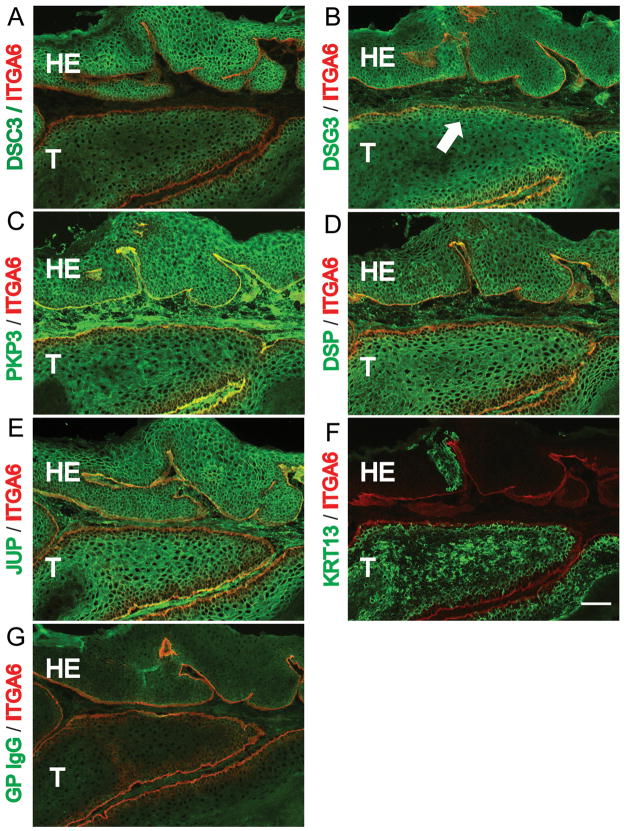
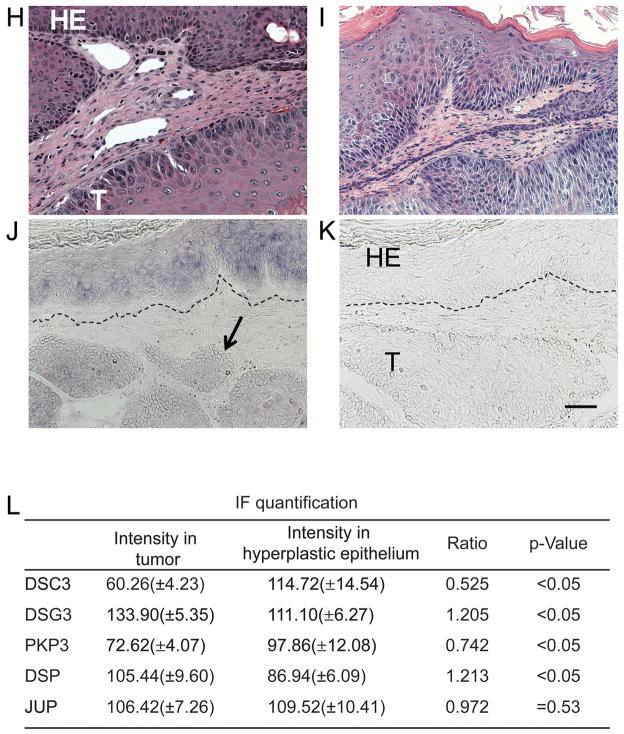
Loss of DSC3 expression in control mouse skin tumors. (A-G) Immunofluorescence microscopy staining of sections through a well-differentiated control (Dsc3fl/+; K-RasG12D; K5.Cre*PR1) tumor. The tumor sections were stained with the antibodies indicated on the left. (A) Note that DSC3 is present at cell-cell borders in the hyperplastic epithelium (HE) overlaying the tumor tissue (T). The tumor has lost DSC3 staining at the cell-cell borders. The remaining weak signal in the cytoplasm most likely represents background staining. (B-E) Other desmosomal markers, such as desmogleins 3 (DSG3), plakophilin 3 (PKP3; a cytoplasmic binding partner for DSC3), desmoplakin (DSP) and plakoglobin (JUP) show normal expression patterns in the tumor tissues. Note that desmosomal proteins normally show a cell type specific expression patterns. For example, DSG3 expression is restricted to the basal and first suprabasal cell layers in normal epidermis and in the tumor tissue (arrow in (B)). (F) The tumor progression marker KRT13 is expressed in tumor tissue that has lost DSC3 expression (compare consecutive tissue sections in (A) and (F)]. (G) Staining with normal guinea pig IgG (negative control staining for section (A)). Counterstaining with an antibody against α6 integrin (ITGA6) demarcates the basement membrane (red). Bar, 50μm. (H) Histological section through the tumor shown in (A) – (G). (I) Histological section through the tumor shown in (J-K). In situ hybridization with Dsc3 (J) anti-sense and (K) sense probes on control tumor sections. The basement membrane zone of the overlaying HE is marked with a dashed line. Note that the hyperplastic epithelium (HE) is positive for Dsc3 mRNA while part of the tumor tissue (T) is negative (arrow in J), indicating loss of Dsc3 gene expression. The sense probe did not hybridize to the tissue section, demonstrating specificity of the ani-sense hybridization for Dsc3 mRNA. Bar, 50μm. (L) Quantification of the immunofluorescence signals obtained with the antibodies shown in A-E. As outlined in MATERIAL AND METHODS, the fluorescence signals in hyperplastic and tumor areas of the same tumor were determine and compared to each other. Expression levels of DSC3 were significantly reduced in the tumor tissue. Note that due to the diffuse background staining in the tumor portion of A, we are likely to overestimate residual DSC3 staining. Note the small but statistically significant reduction in PKP3 expression in the tumor tissue when compared to the hyperplastic epithelium.


