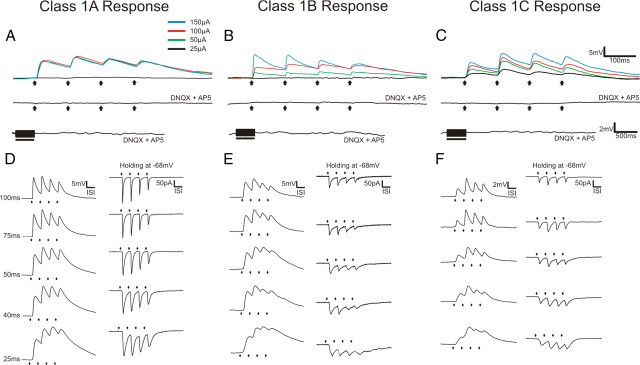
Figure 2.
Examples of Class 1A, 1B, and 1C responses. A, Class 1A response pattern. Upper trace shows response to various intensities of thalamic stimulation. Middle trace shows the absence of a response following thalamic stimulation at 200 μA in the presence of ionotropic receptor antagonists (DNQX and AP5). Lower trace shows the absence of metabotropic glutamate receptor activation following high-frequency stimulation of thalamus at 200 μA in the presence of DNQX and AP5. B, Class 1B response pattern. Upper trace shows response to various intensities of thalamic stimulation. Middle trace shows the absence of a response following thalamic stimulation at 200 μA in the presence of ionotropic receptor antagonists (DNQX and AP5). Lower trace shows the absence of metabotropic glutamate receptor activation following high-frequency stimulation of thalamus at 200 μA in the presence of DNQX and AP5. C, Class 1C response pattern. Upper trace shows response to various intensities of thalamic stimulation. Middle trace shows the absence of a response following thalamic stimulation at 200 μA in the presence of ionotropic receptor antagonists (DNQX and AP5). Lower trace shows the absence of metabotropic glutamate receptor activation following high-frequency stimulation of thalamus at 200 μA in the presence of DNQX and AP5. D, Examples Class 1A responses to different stimulation frequencies at 150 μA in current clamp (left column) and voltage clamp (right column). The value of the ISI is shown to the left and these values for each row apply as well to E and F. E, Example Class 1B responses to different stimulation frequencies at 150 μA in current clamp (left column) and voltage clamp (right column). F, Example Class 1C responses to different stimulation frequencies at 150 μA in current clamp (left column) and voltage clamp (right column). Arrows represent timing of stimulation for all low-frequency stimulation trials. Black bars represent the duration of stimulation in high-frequency stimulation trials. With the exception of high-frequency stimulation trials, all traces represent the average of 10 sweeps.

