
Figure 3.
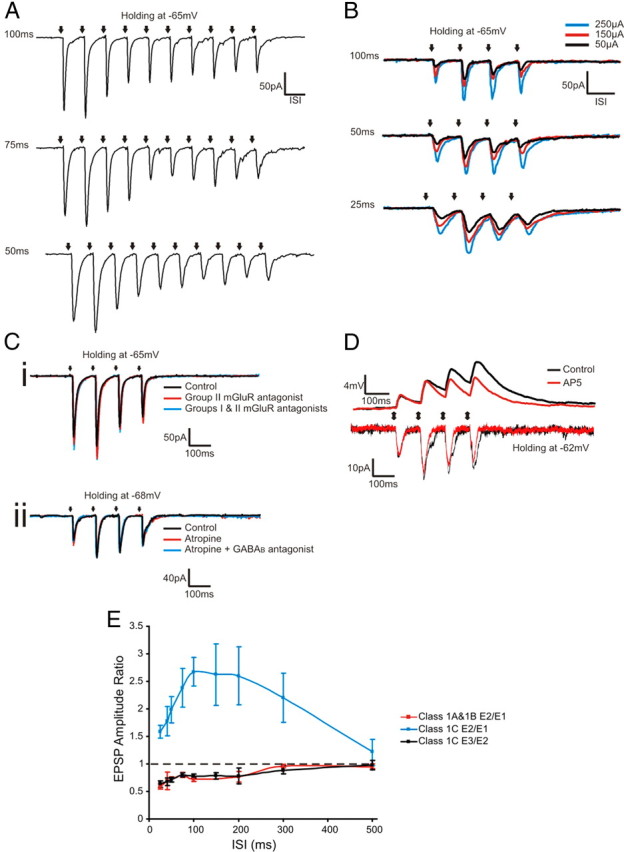
Properties of Class 1C responses. A, Voltage-clamp responses to a train of 10 pulses at various stimulation frequencies (200 μA). The ISI is shown to the left of each trace. B, Voltage-clamp responses at different stimulation intensities and frequencies, and the ISI shown to the left of each trace. Ci, Voltage-clamp responses under control conditions and following bath application of MPPG (Group II metabotropic glutamate receptor antagonist) and MPPG, LY367385, and MPEP (together, LY367385 and MPEP inhibit Group I metabotropic glutamate receptors). Cii, Voltage-clamp responses under control conditions and following bath application of atropine (muscarinic acetylcholine receptor antagonist) and atropine plus CGP 46381 (a GABAB receptor antagonist). D, Voltage-clamp and current-clamp responses during control conditions and following bath application of AP5. E, Changes in EPSP amplitude ratios of the second to first EPSP (E2/E1) or third to second (E3/E2) across stimulation frequencies, showing the mean ± SEM. Black arrows represent the timing of stimulation. All traces in A–D represent averages of 10 sweeps.