
Figure 4.
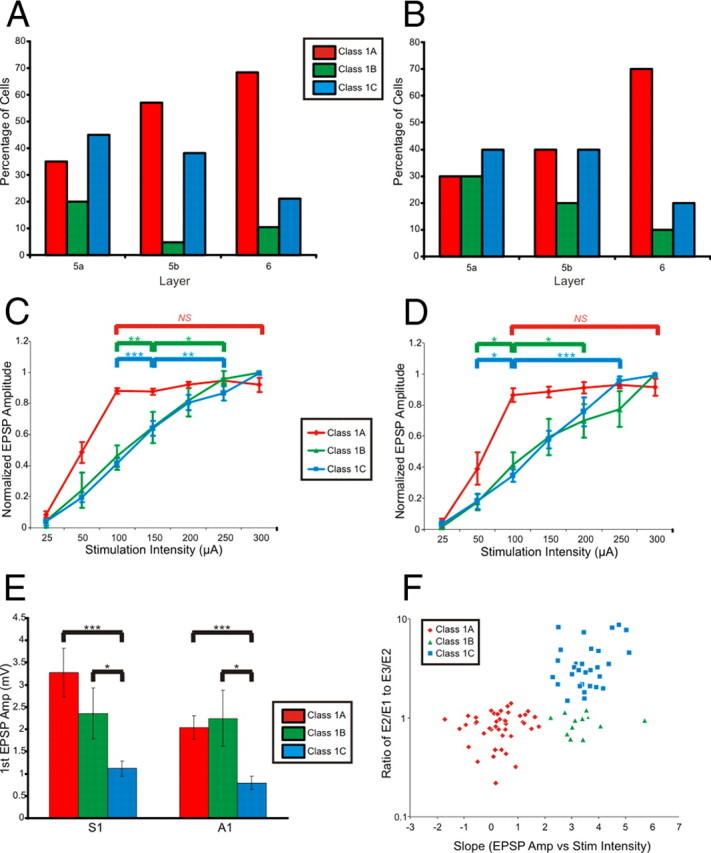
Summary of response properties. A, Proportions of cells with Class 1A, 1B, and 1C response properties in the subgranular layers of S1. B, Proportions of cells with Class 1A, 1B, and 1C response properties in the subgranular layers of A1. C, Relationship between normalized EPSP amplitude and stimulation intensity for cells with Class 1A, 1B, and 1C responses in S1. D, Relationship between normalized EPSP amplitude and stimulation intensity for cells with Class 1A, 1B, and 1C responses in A1. E, Mean ± SEM of first EPSP amplitudes at minimal stimulation intensity. F, Scatter plot of the amplitude ratios of the second to first EPSP (E2/E1) divided by the third to second (E3/E2) versus the slope of the normalized EPSP amplitude versus stimulation intensity (for stimulation intensities 100 μA and above). Error bars are SEM. *p < 0.05, **p < 0.01, ***p < 0.001; NS, not significant.