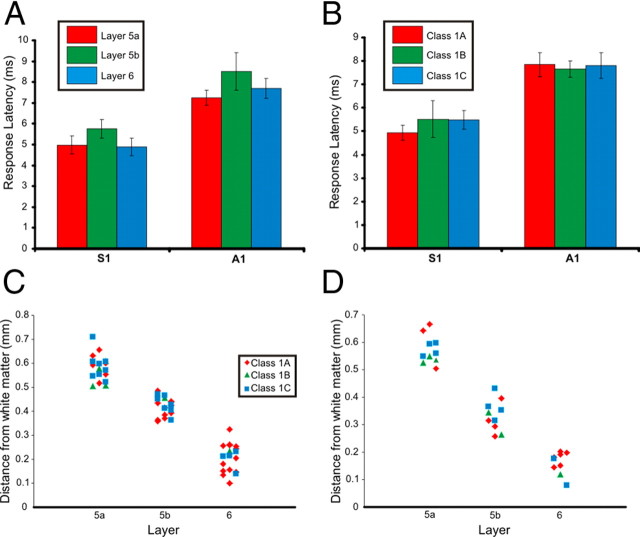
Figure 5.
Response latencies and laminar positions. A, Mean ± SEM of response latencies across layers 5a, 5b, and 6 in S1 and A1. B, Mean ± SEM of response latencies within each response class for neurons in S1 and A1. C, Laminar position (measured as the distance from the white matter) for neurons with Class 1A, 1B, and 1C responses in S1. D, Laminar position (measured as the distance from the white matter) for neurons with Class 1A, 1B, and 1C responses in A1. Horizontal spread of points in C and D is purely to enhance viewing of individual data points.

