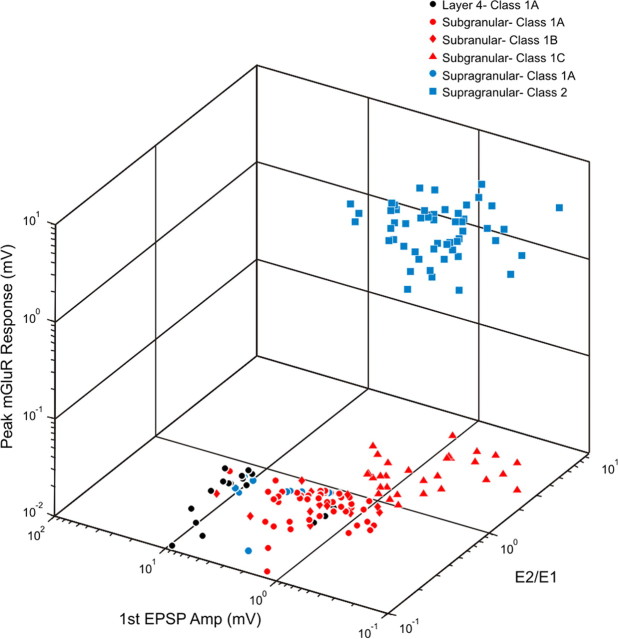
Figure 6.
Three-dimensional scatter plot of all thalamocortical response properties seen in excitatory neurons of S1 and A1. Response properties include first EPSP amplitude at minimal stimulation intensity, the ratio of the second to first EPSP amplitude (E2/E1), and peak metabotropic glutamate receptor response, defined as the largest deflection from baseline in millivolts during the period of 0.25–2 s following high-frequency stimulation. Colors distinguish different neuron locations (i.e., supragranular vs subgranular layers) and shapes distinguish different response classes.

