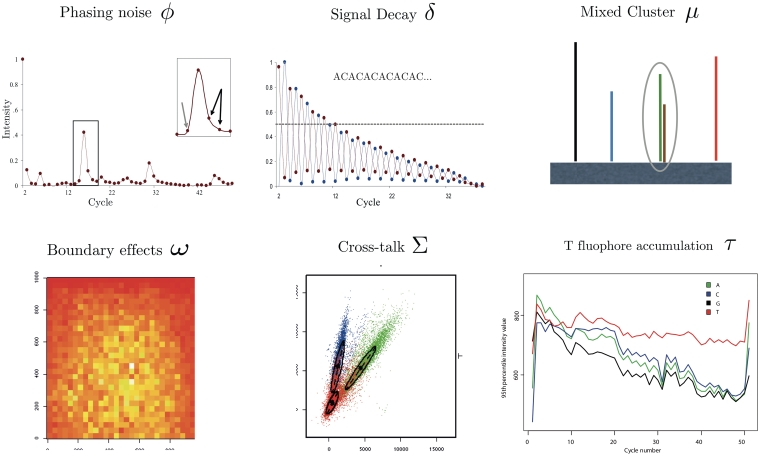
Figure 1:
Illustration of the commonly modeled biases in base-callers for the Illumina platform. ϕ: Phasing can be observed as leading (gray arrow) and lagging (black arrows) signal increase before and after each intensity peak. This is illustrated by the averaged intensities of the cytosine channel when sequencing GCAGTAGTGTTGGTT CTGTAGTGGAATGTGCGGTTGTTGAGAATTCAGTA. Cross-talk correction and normalization have been applied and the first cycle has been omitted. δ: Signal decay is illustrated by the intensity signal of sequencing the micro satellite sequence ACACAC … Shown are the averaged intensities of cytosine (red) and adenine (blue) after crosstalk correction and normalization. Again, the first cycle is not shown. µ: Mixed clusters occur whenever more than one template collocate on the tile. ω: The image shows local averages of the fluorescence intensities across the area of a tile. Due to optical effects, stronger intensities are measured toward the center of the image. Σ: The intensity quadruples of the four bases are not orthogonal. Shown is the projection of measured intensities of the first sequencing cycle of the phiX174 data onto the axes corresponding to A and C. τ: In past chemistries the T-fluophore was not washed away efficiently and hence accumulated with growing number of cycles. The illustration shows the intensity values for one tile of a 51-cycle PhiX 174 RF1 run after correction by Bustard. Shown is the 95th percentile for the signal intensities in each channel and cycle. Figure credits: ϕ, δ from [16]; ω, Σ from [17]; τ from [18].

