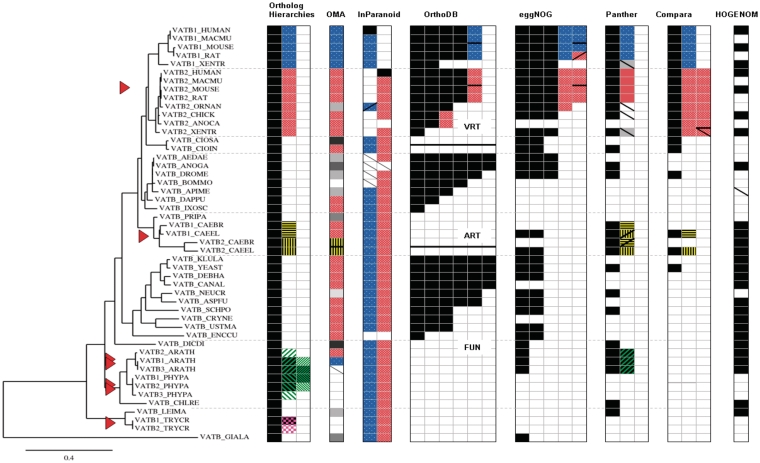
Figure 2:
Reference tree for the V-type ATPase β-subunit subfamily and corresponding ortholog predictions from seven phylogenomic databases. The different grouping strategies are clearly reflected: OMA, InParanoid and the unlabeled trees of HOGENOM occur as mutually exclusive groups, while all other databases possess hierarchical grouping strategies. Most orthology predictions coincide with those of the reference tree, but none of the phylogenomic databases is in full agreement with all of them: OMA groups are split into more groups than necessary, which results in less predicted gene relationships; InParanoid predicts the B2 subunit of Ornithorhynchus anatinus to be an ortholog of the human B1 subunit and lacks some of the arthropod orthologs; OrthoDB assigns corresponding 1:1 orthologs only for closely related species such as primates or rodents; eggNOG gives contradictory information on the B2 subunit of Xenopus tropicalis; the tree topology of Panther suggests lineage-specific duplications for the paralogs of X. tropicalis, Caenorhabditis elegans and C. briggsae; the tree of Compara includes an additional duplication event within the vertebrate B2 clade; HOGENOM differs from the reference tree only by the inversion of a speciation node (data not shwn) and lacks one of the expected orthologs in the data set. Missing orthologs are also observed for OMA, InParanoid and Panther. Explanation: the left block (headed ‘Ortholog hierarchies’) indicates the ortholog classification derived from the reference tree, with the largest homolog group given in the first column; different levels of orthologous hierarchies are shown as patterned cells in the right-handed columns. Corresponding groups defined by the phylogenomic databases are patterned accordingly, if relevant to the benchmarked ortholog classification. Triangle: gene duplication event. White cell: gene of species that are not covered by the database. Plain gray cell: gene assigned to an unexpected ortholog group. Descending diagonal: expected gene that was missing in an ortholog group. Ascending diagonal: false positive prediction. Black horizontal bar: groups of the same hierarchical level within the same column. For OrthoDB the black bar also separates the three taxonomic sections of the database (VeRTebrate, ARThropods, FUNgi). For more details, see Supplementary Figure S3.

