
Table 2:
Benchmarking results based on three reference trees
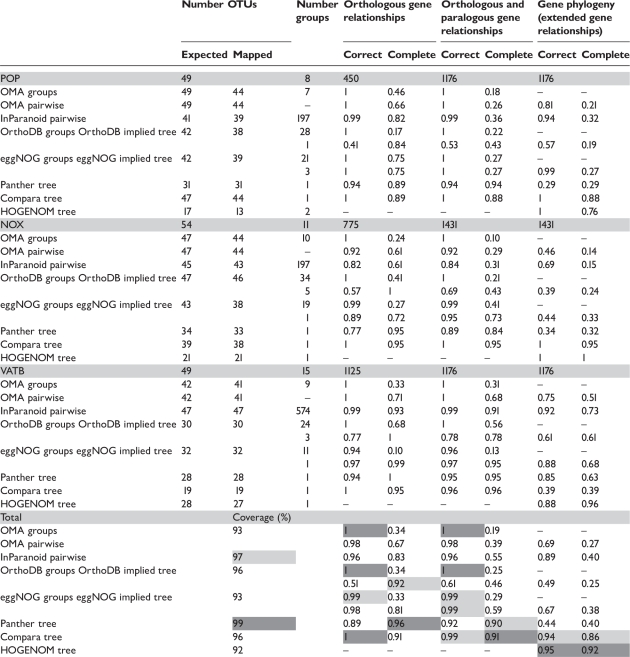 |
The analyzed databases are OMA pure orthologous groups and pairwise groups, InParanoid, OrthoDB, eggNOG, Panther trees and HOGENOM. Databases with a hierarchical grouping concept are scored in two ways, based on the ortholog groups and based on the implied trees. For HOGENOM, the calculation is based on Robinson Foulds distances. Columns: ‘Expected OTUs’: number of genes expected to be present in an ortholog group according to the species list of the phylogenomic database. ‘Mapped OTUs’: number of genes of the reference tree that are mapped to the ortholog groups; ‘Number groups’: number of groups relevant to the reference tree. Scores are calculated for the three types of gene relationships: orthology, orthology/paralogy and ‘extended’ gene relationships. The weighted average is shown bottom left of the table. For each column, the best achieved values are shaded dark gray, the second-best light gray. ‘Coverage’ indicates the weighted average of mapped genes, in percent. For each family, the number of genes and the number of relevant gene relationships are indicated within the gray header row.