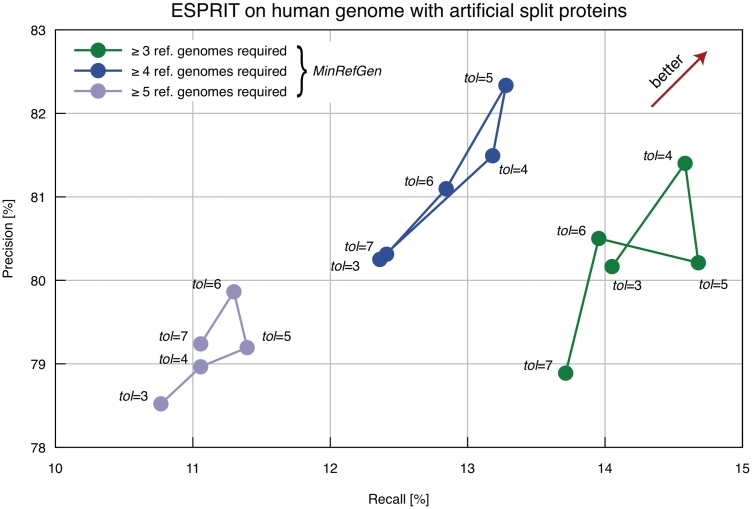
Figure 3:
Evaluation of ESPRIT based on human genome with artificial split introduced in 8% of all CDSs. The y-axis depicts the percentage of accurate predictions [(true positive)/(true positive + false positive)]. The x-axis depicts the percentage of all artificial splits (2071 cases) that were covered by the predictions [(true positive)/(true positive + false negative)]. The figure shows performance for various combinations of the two main parameters: the minimum number of reference genome with full-length homolog (parameter MinRefGen) and tolerance value (parameter tol) for the difference in distance between two fragments and their full-length homolog.

