
Fig. 2.
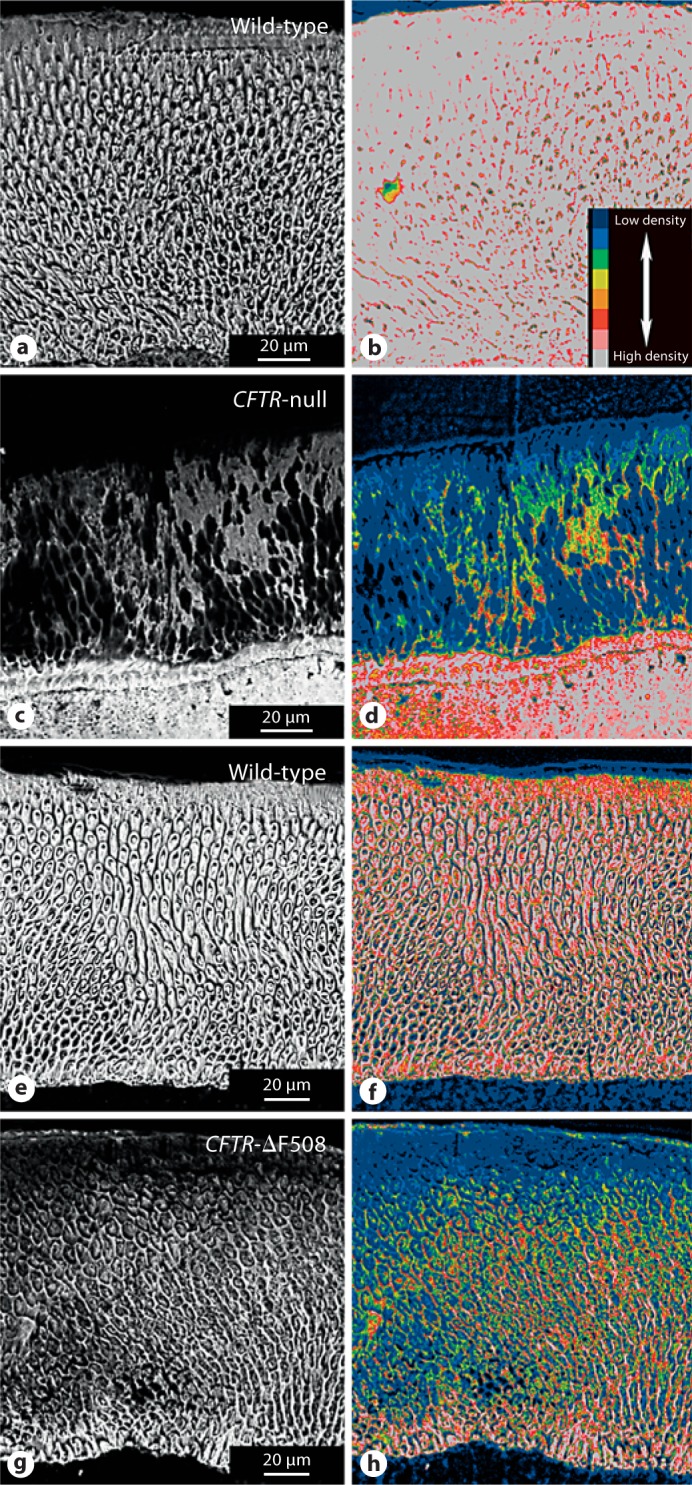
BSE imaging of enamel of porcine CFTR animals. Wild-type (a) and CFTR-null enamel (c) comparisons illustrate a severe morphological defect in the null animal. Signal intensity was reduced in the wild-type relative to the null animal to lower the image content out of white (255 grey level) into interpretable morphological details. Wild-type (e) and CFTR-ΔF508 (g) enamel comparisons; both images were acquired under identical signal intensity settings. Grey-level images (a, c, e, g) were subjected to an 8-bit color look-up table (b, d, f, h), respectively, for visual comparison to represent differences in mineralization density between samples; see color code inset (b), wherein cool colors denote a lower mineralization density and hot colors represent higher mineralization densities. For each figure, the dentine is at the bottom of the image.