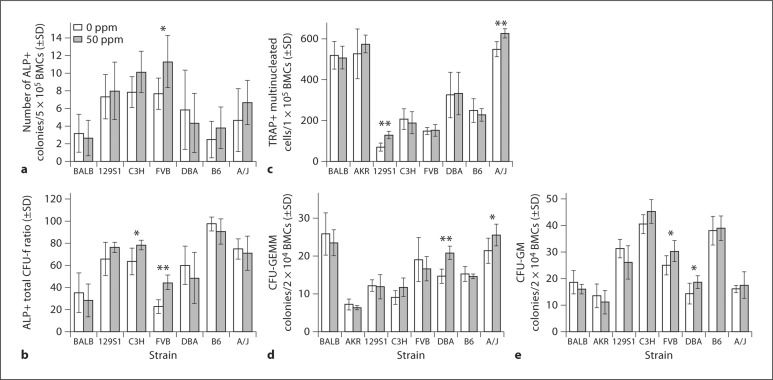
Fig. 3.
Ex vivo BMC cultures. BMCs were cultured in osteogenic media to count the number of ALP-positive colonies/5 × 105 BMCs (a) and the ratio of ALP-positive to total CFU-F colonies (b). OC, BMCs treated with mCSF and sRANKL and TRAP-positive cells with ≥3 nuclei counted as osteoclasts/1 × 105 cells (c). CFU-GEMM and CFU-GM colonies/2 × 104 BMCs (d, e). n = 6–8; ∗ p ≤ 0.05 and ∗∗ p ≤ 0.001 between treated and untreated groups in each strain.

