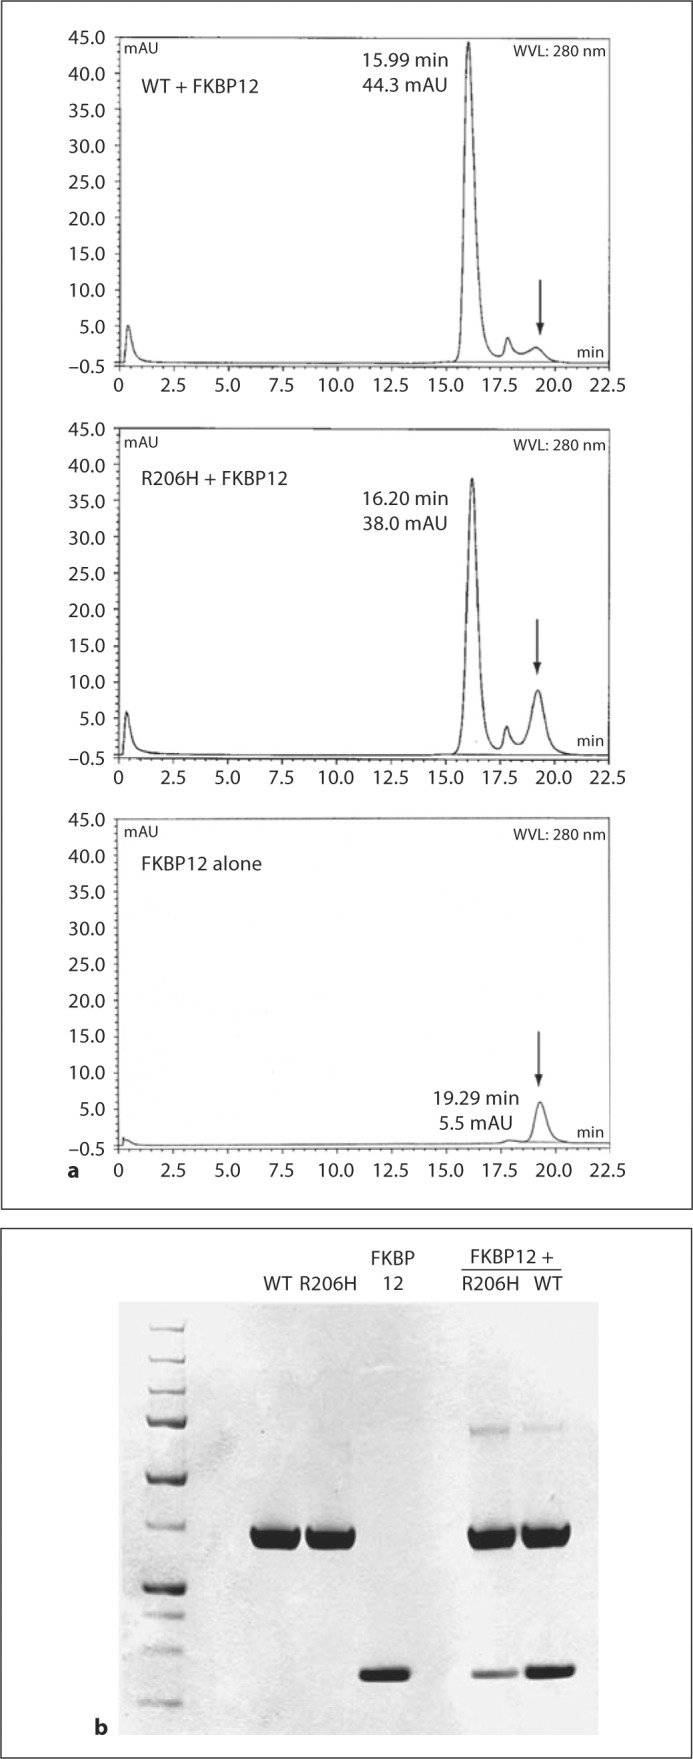
Fig. 2.

HPLC SEC analyses of FKBP12-kinase interactions. a Chromatograms (mAU, 280 nm) of kinase proteins mixed with FKBP12 at 1:1 (WT) and 1:2 (R206H) molar equivalents and of FKBP12 alone (1 equivalent). Arrows mark the position of FKBP12 elution. b The 3 left lanes of lower SDS-PAGE analysis are reference samples, and the 2 right lanes are peak fractions of the kinases mixed with FKBP12 at 1:1 (WT) and 1:2 (R206H) equivalents (see above).
