
Figure 5.
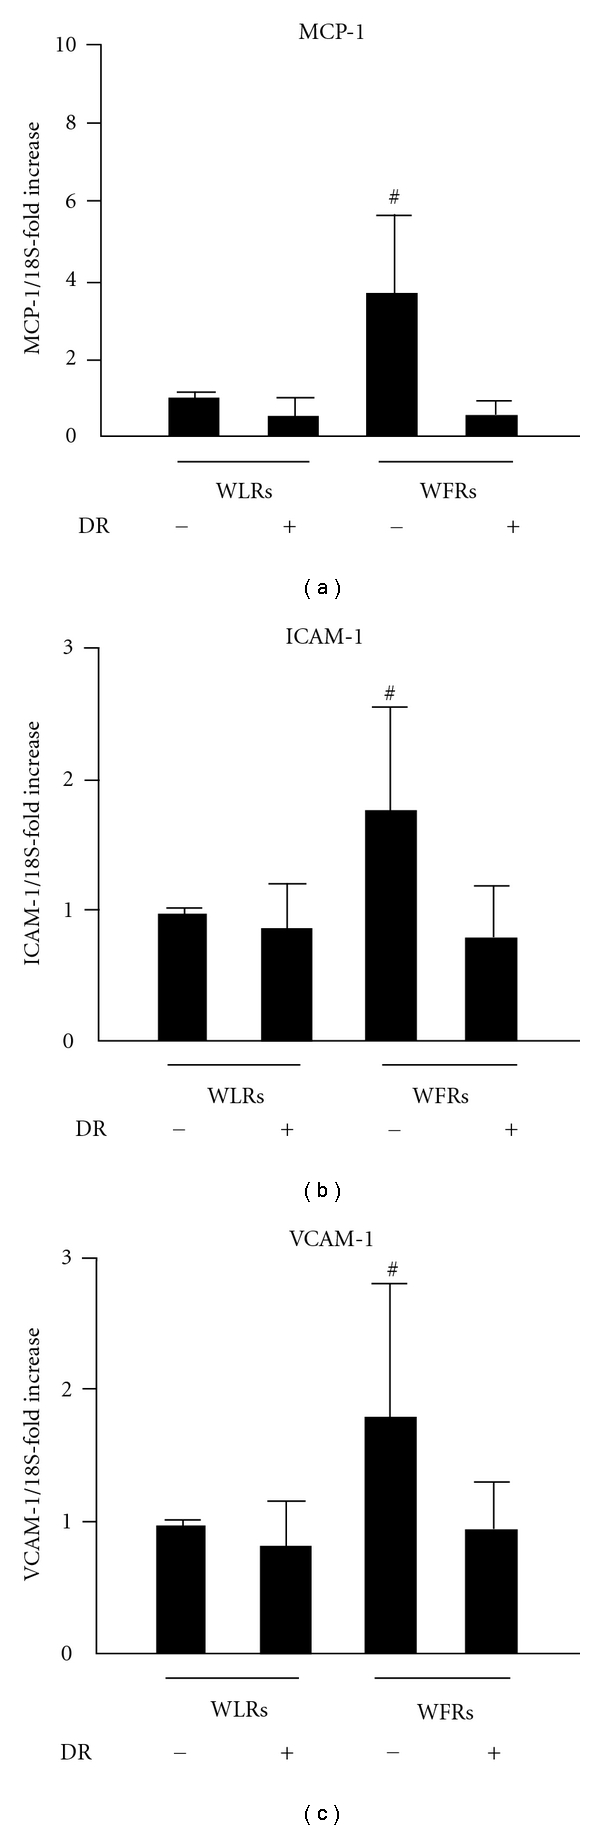
MCP-1, ICAM-1, and VCAM-1 mRNA expression levels in the kidney. The mRNA expression levels of MCP-1 (a), ICAM-1 (b), and VCAM-1 (c) were quantified using real-time PCR and expressed as fold increases from Wistar fatty rats. Data are means ± SD (n = 9 − 11, # P < 0.05 versus other groups).