Figure 1.
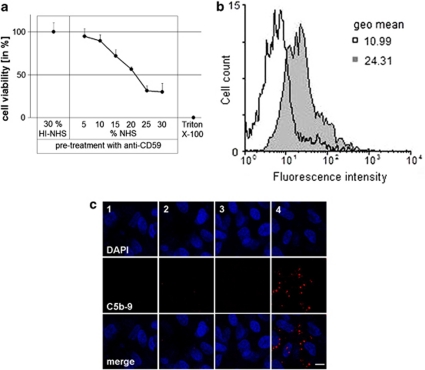
Verification of sub-lytic MAC assembly. (a) MTT viability assay measuring the amount of cell death after treating ARPE-19 cells with anti-CD59, and ascending concentrations of NHS for 1 h at 37 °C. For negative controls, cells were treated with anti-CD59/HI–NHS, and for positive controls with 1% Triton X-100. Data are plotted as means±s.d. (n=5). (b) The mean fluorescence intensity of C5b-9 using flow cytometry presented as a histogram in control (anti-CD59/HI–NHS; open histogram), and anti-CD59/NHS-treated cells (grey histogram) (n=4 for each treatment). (c) Representative images (n=4) from immunofluorescence staining for C5b-9 after MAC assembly on ARPE-19 cells. 1=HI–NHS alone, 2=NHS alone, 3=anti-CD59/HI–NHS, 4=anti-CD59/NHS. The scale bar indicates 10 μm.

