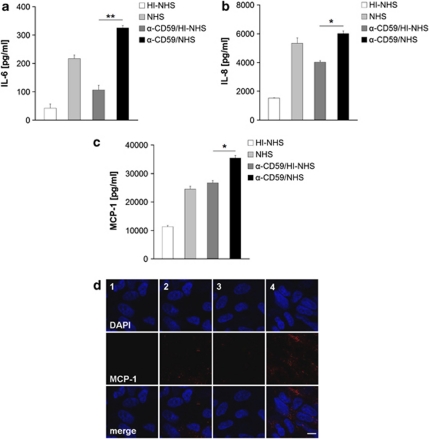
Figure 2.
Cytokine production by RPE. Representative (a) IL-6, (b) IL-8, and (c) MCP-1 production after various treatments as measured in the cell culture supernatant by ELISA. Duplicate data are shown as mean±s.d. (n=3). (d) Representative immunofluorescent staining of MCP-1 following treatment with HI–NHS (1), NHS (2), anti-CD59/HI–NHS (3), and anti-CD59/NHS (4) out of 4 separate experiments. The scale bar indicates 10 μm. *P<0.05, **P<0.01.

