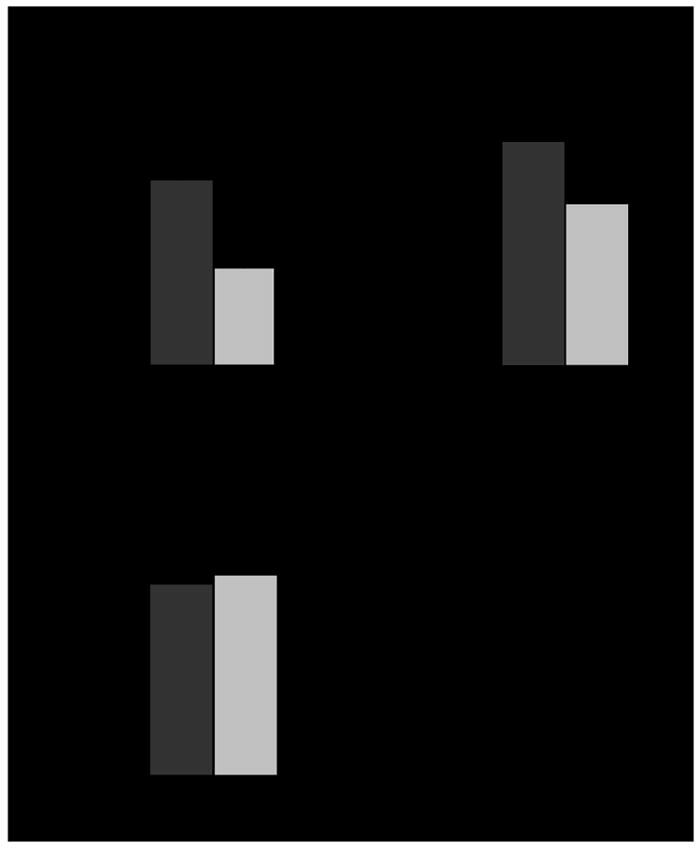
Figure 1. The protein C system in the endocardium of the RAA and LAA.

(A) Thrombin-dependent generation of APC was measured ex vivo on the endocardial surface of RAA and LAA samples of macaque origin (n = 6). The protein C activation assay was performed in duplicate. The mean ± SD of six independent experiments is represented. (B) Thrombomodulin and (C) EPCR expression on the endocardial surface of the RAA and LAA The mean ± SD of the tissue expression is represented in arbitrary intensity units (AIU). (D) The R2 Spearman’s correlation coefficient between the difference in the thrombomodulin expression (RAA–LAA) and the difference in the APC generation (RAA–LAA). Δ, RAA-LAA
