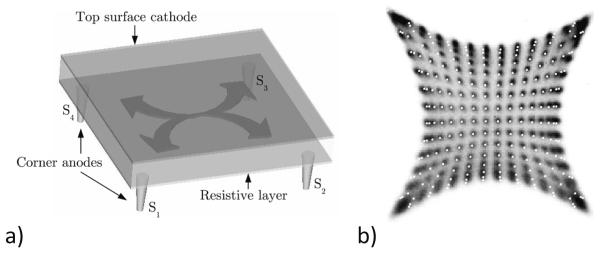
Figure 8.
a) A schematic representation of a PSAPD showing the four contacts at the corners of the resistive layer with arrows indicating the charge division in the resistive layer. b) Raw flood image from PSAPD readout of a scintillator crystal array. The superposed white dots are from a simulation of the charge division process. From (Despres et al., 2007).

