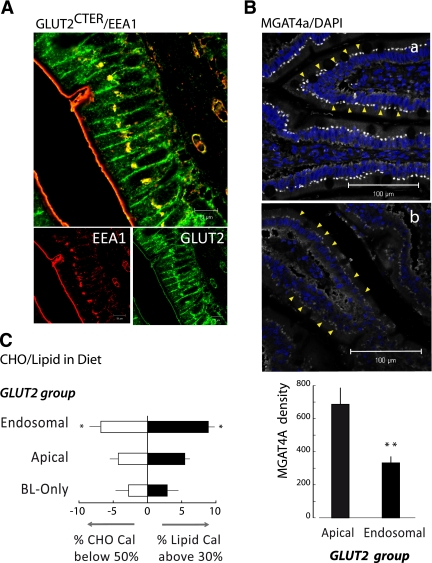
FIG. 2.
Accumulation of GLUT2 in endosomes in jejunal enterocytes of obese subjects. A: Representative image of the colocation (yellow) of GLUT2 (green) with the endosome marker EEA1 (red). Confocal microscopy images were performed as in Fig. 1 (scale 10 μm). B: Representative images of MGAT4a glycosyltransferase protein expression comparing the jejuna of obese subjects with apical or endosomal GLUT2 accumulation. Immunolabeling and confocal image acquisitions were performed in parallel in apical (a, n = 10) and endosomal (b, n = 10) groups. Yellow arrows identify the location of MGAT4 in the enterocytes. Quantification of MGAT4a density in both types of subjects was measured with the ImageJ software (**P < 0.0041). C: Carbohydrate (CHO) and lipid calories in diets of obese subjects grouped according to GLUT2 location, i.e., only in basolateral membrane (BL-only), in endosomal, or in apical membranes. Data represent the average deviation of calorie content ± SEM (>30% lipid calorie, ■; *P < 0.038) or carbohydrate calorie (<50%, □; *P < 0.043). (A high-quality digital representation of this figure is available in the online issue.)

