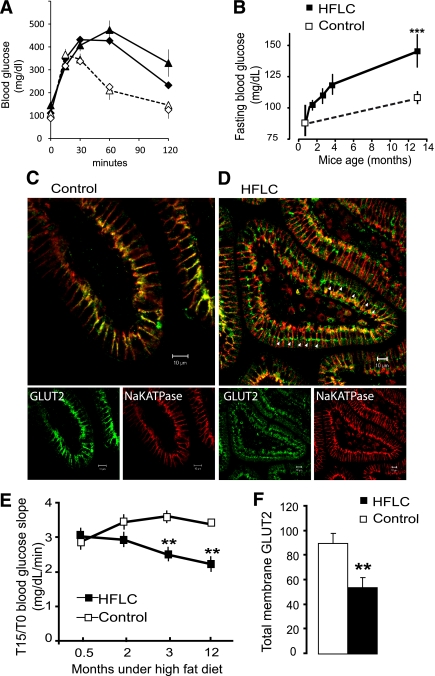
FIG. 3.
Endosomal accumulation of GLUT2 in mice fed a high-fat diet. Mice were fed either the control chow diet (M25, white symbols) or HFLC diet (black symbols) for up to 12 months. A: OGTTs are shown after 2 months (diamonds) and 12 months (triangles) in two groups of eight mice fed the control or HFLC diet. B: Fasting blood glucose concentration increases were measured with time (mg/dL ± SEM; n = 8; ***P < 0.001). C and D: Representative confocal images of GLUT2 (green) and Na,KATPase (red) location in 6-μm sections of control and HFLC jejuna after 12 months. Scale 10 μm. Note the endosomal accumulation of GLUT2 (arrows) and low basolateral GLUT2 in the jejunum of HFLC-fed mice compared with control diet mice. E: Initial slopes (T15/T0) of blood glucose concentration after OGTT (**P < 0.01) estimating sugar absorption. In F, quantification of GLUT2 abundance by Western blot (density arbitrary units ± SEM, **P < 0.01) is shown in postnuclear membrane preparations of control and HFLC jejuna. (A high-quality digital representation of this figure is available in the online issue.)

