FIG. 4.
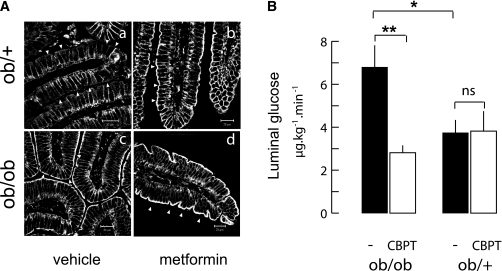
Apical GLUT2 increase after metformin treatment and the functional significance in obese mice. A: ob/ob mice fed a standard diet (M25) received either the H2O vehicle or 25 mg/kg metformin twice a day for 10 days. Representative confocal images of GLUT2 location in jejuna from fasted ob/+ (upper row) and ob/ob (lower row) mice after treatment with vehicle (left column) or metformin (right column) are shown. Arrowheads indicate the apical side of enterocytes. Scale 10 μm. B: Release of glucose in the luminal content of freely moving ob/ob and ob/+ mice measured 30 min after an intravenous injection of radioactive 3-OMG tracer. Mice were fasted overnight and received 1 g/kg glucose by intraperitoneal injection. Before tracer injection, half of the mice also received by gavage an oral bolus of ethanolic water (1/1,000, vol/vol) containing cytochalasin B (0.3 mmol/L) and phloretin (1 mmol/L) (CBPT, □) or vehicle (■). Data are expressed as μg ⋅ kg−1 ⋅ min−1 ± SEM. Controls (n = 8) and CBPT (n = 4) per phenotype are shown. *P < 0.05, **P < 0.01.

