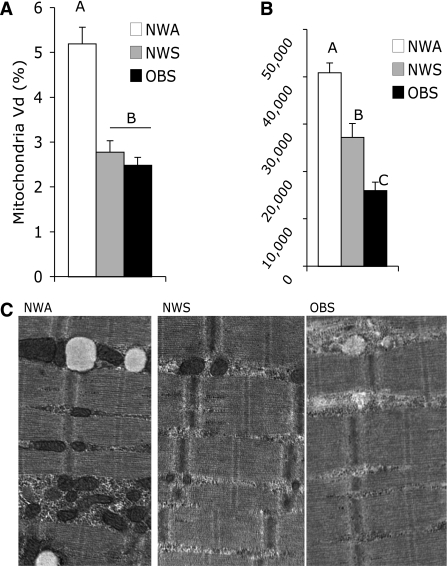
FIG. 4.
Mitochondria and markers of oxidative capacity in vastus lateralis. Mitochondria volume density (A), example of micrographs (B), and SDH content (C). Bars are mean values, and error bars are SEMs. The letters A, B, and C above the bars denote significant differences between groups (P < 0.05, one-way ANOVA).

