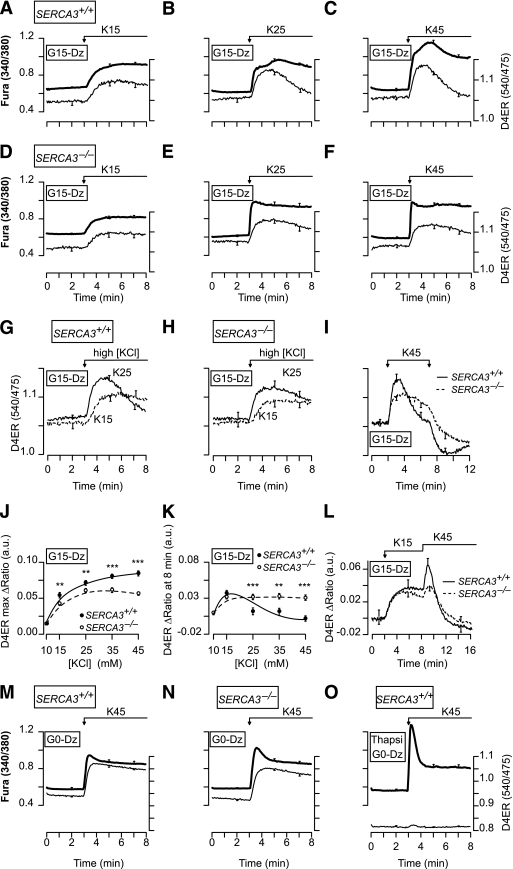
FIG. 4.
Characteristics of the [Ca2+]ER changes elicited by rises in [Ca2+]c of various amplitudes in β-cells from SERCA3+/+ and SERCA3−/− mice. A–F: Simultaneous measurement of [Ca2+]c (FuraPE3) and [Ca2+]ER (D4ER) in β-cells from SERCA3+/+ (A–C) or SERCA3−/− (D–F) mice perifused with 15 mmol/L glucose (G15) and 250 µmol/L Dz. Cells were stimulated with 15 mmol/L (K15) (A and D), 25 mmol/L (K25) (B and E), or 45 mmol/L (K45) K (C and F) as indicated. G–I and L: Comparison of [Ca2+]ER (D4ER) changes in β-cells from SERCA3+/+ (G, I, and L) or SERCA3−/− (H, I, and L) mice under various KCl stimulations, as indicated. J and K: Quantifications of the effects of the various [KCl] on the maximal [Ca2+]ER achieved after the change in [KCl] (J), and on [Ca2+]ER 5 min after the change in [KCl] (K). They show that [KCl] dose dependently increased [Ca2+]ER soon after the depolarization, but not 5 min after the depolarization as the [Ca2+]ER rise became smaller for [KCl] >15 mmol/L. **P < 0.01 and ***P < 0.001, for the comparison between SERCA3+/+ and SERCA3−/− islets at each [KCl], respectively. M–O: Simultaneous measurement of [Ca2+]c (FuraPE3) and [Ca2+]ER (D4ER) in β-cells from SERCA3+/+ (M and O) or SERCA3−/− (N) mice perifused with a glucose-free medium (G0) and 250 µmol/L Dz, and stimulated with 45 mmol/L KCl as indicated. O: β-cells were pretreated for 30 min with 1 μmol/L thapsigargin (Thapsi) prior to the experiments. Values are means ± SE for 29–81 cells from three to six experiments with three to four islet preparations.

