FIG. 8.
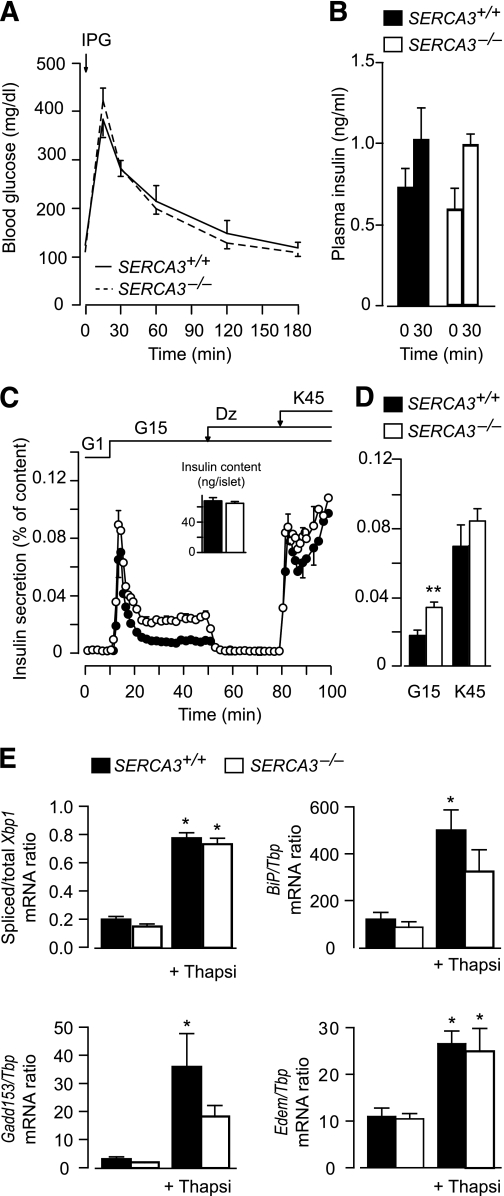
SERCA3 ablation does not affect glucose tolerance, increases glucose-induced insulin release, and does not induce ER stress. A and B: Changes in blood glucose (A) and plasma insulin levels (B) in SERCA3+/+ and SERCA3−/− mice in response to an intraperitoneal glucose tolerance test (2.4 g/kg body weight). C: Batches of 25–30 SERCA3+/+ and SERCA3−/− islets were perifused with a medium containing 1 or 15 mmol/L glucose (G) or 250 µmol/L Dz, as indicated. The [KCl] of the medium was increased from 4.8 to 45 mmol/L when indicated. Insulin secretion is expressed as percentage of islet insulin content. Values are means ± SE of four to five experiments. D: Integrated insulin secretion calculated in the experiments shown in C from minute 10 to 50 for glucose stimulation and from minute 80 to 100 for K45 stimulation. E: After isolation, islets from SERCA3−/− mice and SERCA3+/+ mice were precultured for 1 week in serum-free RPMI 1640 medium containing 10 mmol/L glucose and 5 g/L BSA. They were then cultured 18 h in the same medium with or without 1 µmol/L thapsigargin (TG). After culture, islet total RNA was extracted and reverse-transcribed into cDNA as previously described (50). Xbp1 mRNA splicing and Gene:Tbp mRNA ratio were measured by PCR as described earlier (50), with the exception of the use of mouse-specific primers (Xbp1 sense 5′-CAAGGGGAGTGGAGTAAGGC-3′ and antisense 5′-GGCAACAGTGTCAGAGTCCAT-3′; other primers see Marhfour et al. [27]). Data are means ± SEM for three islet preparations. *P < 0.05 for the effect of TG in the same type of islets; there were no significant differences between SERCA3+/+ and SERCA3−/− islets.

