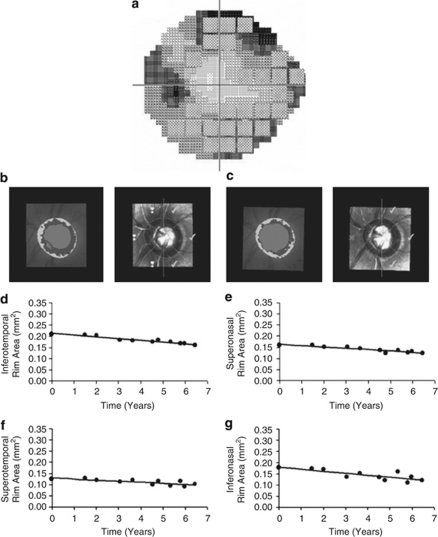
Figure 1.
Disc and field progression in subject 9. (a) Visual field grey scale at the conclusion of the study; the hatched squares indicate the test points flagged as progressing according to the standard PLR criteria; (b) HRT baseline mean topography; (c) HRT mean topography at the conclusion of the study period. (d–g) Scatterplots with regression line for sectoral RA against time. (From Strouthidis et al22).

