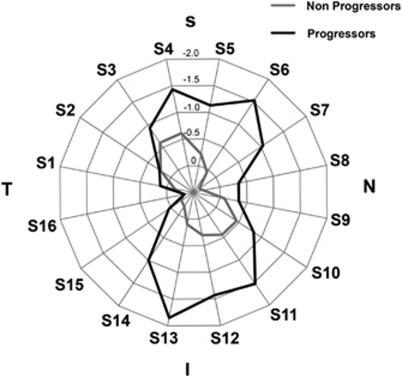
Figure 2.
Radar plot illustrating the rates of change in SLP with ECC retinal nerve fibre layer measurements according to the sectors around the optic disc. Eyes that showed progression on visual fields and/or optic disc stereophotographs had greater loss of the RNFL in the inferior and superior sectors. I, inferior; N, nasal; S, superior; T, temporal. (From Medeiros et al19).

