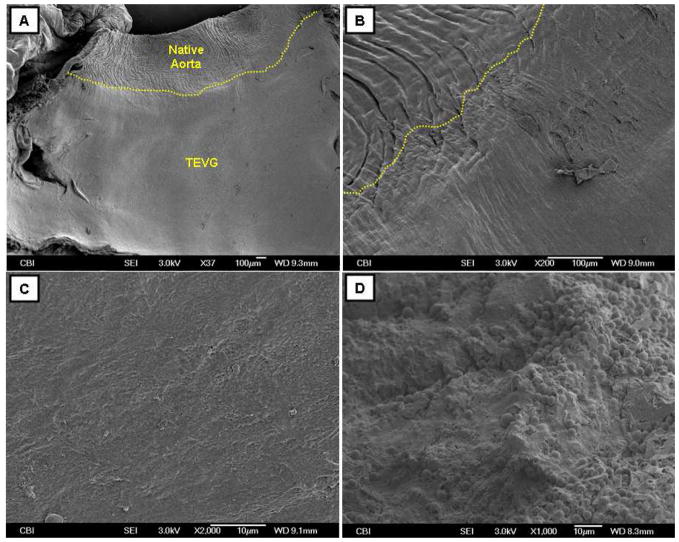
Fig. 6.
Representative SEM micrographs of the (A-C) hP-seeded TEVG and (D) unseeded control. (A) Luminal surface of the hP-seeded TEVG with adjacent rat aorta; (B) higher magnification of the anastomosis site between the rat aorta and the hP-seeded TEVG; (C) higher magnification of the luminal surface of the hP-seeded TEVG; (D) luminal surface of the unseeded control, showing the platelet aggregation. Anastomosis is manually depicted in (A and B).

