
Figure 3.
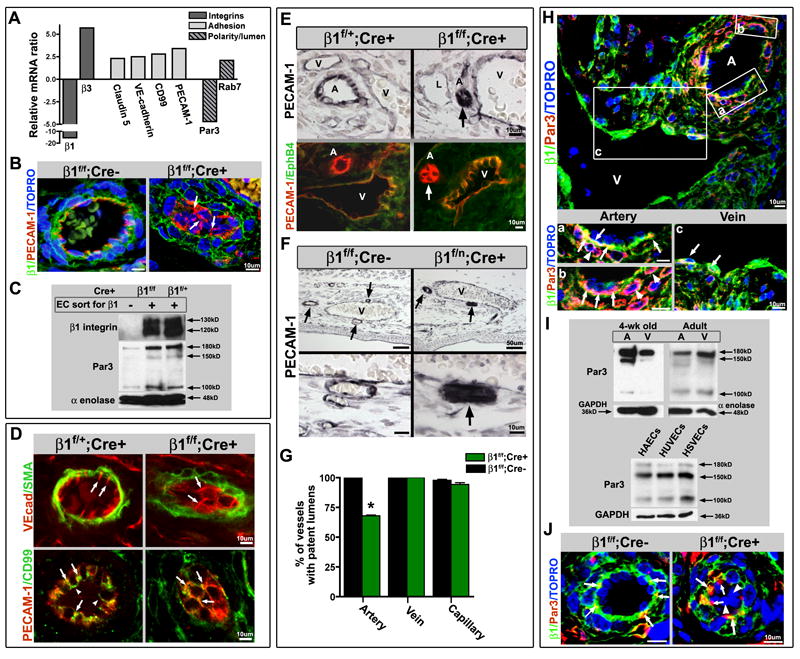
Luminal occlusion and loss of polarity is an arterial phenomenon. (A) Microarray analysis of endothelial cells (ECs), sorted based on β1 integrin protein expression (from E16.5 β1f/f;Cre+ embryos), exhibited increased levels of adhesion related genes, and a decrease in the polarity gene Par3. (B) Loss of β1 integrin protein (green) results in mis-localization of PECAM-1 (red) from laterally placed cell-cell contacts to global cell surface expression (arrows). TOPRO-3 nuclear stain in blue. (C) To confirm loss of β1 integrin and Par3 on a protein level, ECs sorted in the same manner were evaluated by Western blot. Sorted β1+ and β1- endothelial cells from β1f/f;Cre+ mice, and β1+ ECs from β1f/+;Cre+ mice were loaded equally by cell number, and demonstrated loss of β1 and Par3 protein (α-enolase loading control). (D) Normally polarized expression of VE-cadherin (top panel in red, SMA in green) at lateral cell-cell contacts (arrows) is dispersed and circumferentially expressed in cells occluding the lumen within β1f/f; Cre+ vessels (arrows). CD99 (bottom panels, green) demonstrates a polarized apical expression (arrowheads), and lateral co-localization with PECAM-1 (yellow, arrows), that after β1 integrin ablation redistributes to surround the cell at E15.5 (arrows), much like PECAM-1 (in red). (E) Luminal occlusion is distinctly noted in arteries (arrows), as delineated by PECAM-1 (top panels in black, bottom panels in red) and lack of EphB4 (bottom panels, green) expression. “A” denotes arteries, “V” veins, and “L” lymphatics. (F) The extent of occlusion can vary in mid-sized arteries (arrows) at E15.5 after endothelial β1 integrin deletion, but as compared to nearby veins is a distinctly arterial phenomenon. Lower panels are high magnification of vessels in upper panels. PECAM-1 in black. (G) Vessels were evaluated at E15.5, quantified for luminal patency, and confirmed that the phenotype is exclusively arterial (n=5 each, *p< .001). (H) Par3 protein expression is preferentially expressed in embryonic arteries, as evidenced in β1f/f;Cre- at E15.5 (Par3 in red, β1 integrin in green, TOPRO-3 nuclear stain in blue). Panels (a) – (c) are higher magnification of A – V pair above. (H-a,b) Par3 co-localizes with β1 integrin (yellow) in the basal aspect of the arterial endothelial layer (arrows), but is also prominent in the surrounding smooth muscle cell layer (in red, arrowheads). (H-c) Veins also express Par3 in conjunction with β1 (yellow, arrows), but to a lesser extent than arterial vessels. (I) To evaluate Par3 expression in vessel subtypes, dorsal aortas (A) and inferior vena cavas (V) of 4 week old and adult animals were flushed with Laemmli buffer and evaluated by Western blot. Primary human endothelial cells were evaluated for Par3 expression among vessel subtypes (human aortic endothelial cells – HAECs, human umbilical vein ECs - HUVECs, and human saphenous vein ECs – HSVECs). GAPDH and α-enolase loading controls. (J) Normal basal expression of Par3 (red) with co-expression of β1 integrin (in green, co-localization in yellow) in β1f/f; Cre- vessels (arrows) is aggregated and mis-localized in β1f/f; Cre+ vessels (arrows), with complete absence in β1 deleted cells within the vessel lumen (arrowheads). TOPRO-3 nuclear stain in blue. (B, D-F, H, J) Scale bars as labeled for each row. See also Figure S3.