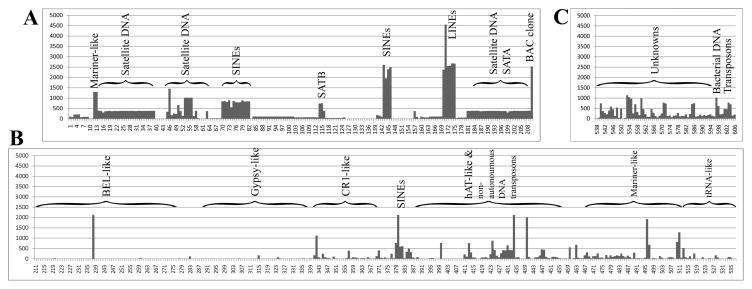
Fig. 1. Frequencies of repetitive elements in the tilapia genome.
A map of the tilapia repeat library that was established from three sequence sources is shown: A. Tilapiini repeat-sequences from GenBank; B. O. niloticus sequences orthologous to the repeat library of zebrafish in Repbase; C. novel O. niloticus repeats mostly detected by genome analysis using MIRA assembler. Under the horizontal axis the repeat number within this library is indicated. The vertical axis denotes the number of significant hits obtained by BLAST search against our local database, which consist mostly of O. niloticus BAC-end sequences. Types of repeats that form major landmarks in this map are indicated above major frequency peaks and above regions of repeat superfamilies delineated with brackets.

