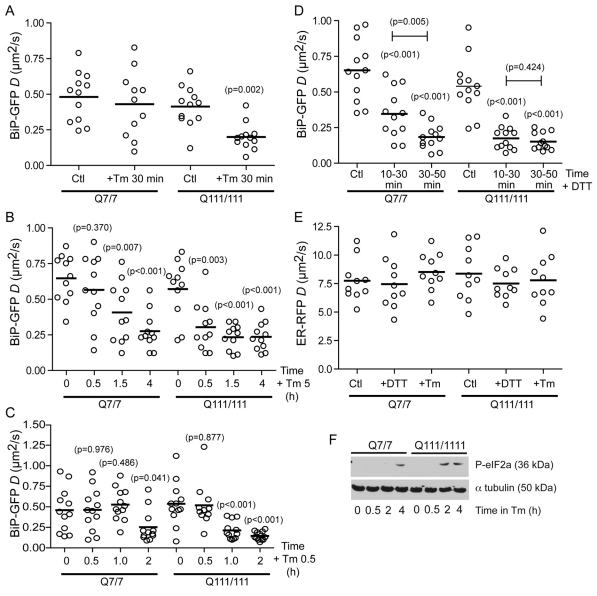
Fig. 5.
BiP availability reveals increased sensitivity to ER stress in STHdhQ111/111 cells. (A) D values of single STHdhQ7/7 and STHdhQ111/111 cells transfected with BiP–GFP for 16 hours, and either left untreated (Ctl) or treated with 5 μg/ml Tm for 30 minutes and analyzed by FRAP. (B) D values of single STHdhQ7/7 and STHdhQ111/111 cells transfected with BiP–GFP for 16 hours and treated with 5 μg/ml Tm for 30 minutes, 1.5 hours and 4 hours. (C) D values of single STHdhQ7/7 and STHdhQ111/111 cells transfected with BiP–GFP for 16 hours and treated with 0.5 μg/ml Tm for 30 minutes, 1 hour and 2 hours. (D) D values of single STHdhQ7/7 and STHdhQ111/111 cells transfected with BiP–GFP for 16 hours and treated with 2.5 mM DTT. D values are binned into 20 minutes intervals. (E) D values of single STHdhQ7/7 and STHdhQ111/111 cells transfected with inert ER–RFP for 16 hours and treated with either 2.5 mM DTT for 30 minutes or 5 μg/ml Tm for 4 hours and analyzed by FRAP. (F) Immunoblots of the UPR reporter phosphorylated eIF2α from STHdhQ7/7 and STHdhQ111/111 cells treated with 5 μg/ml Tm for the indicated times. Equal loading was confirmed by reprobing with anti-α-tubulin. Statistically significant differences between treated and untreated cells for the same cell line (unless otherwise specified) are shown in parentheses above the data sets.

